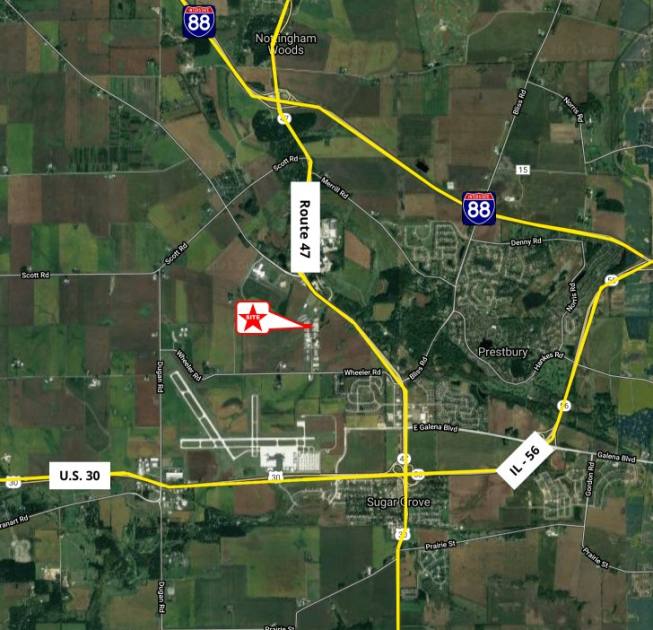
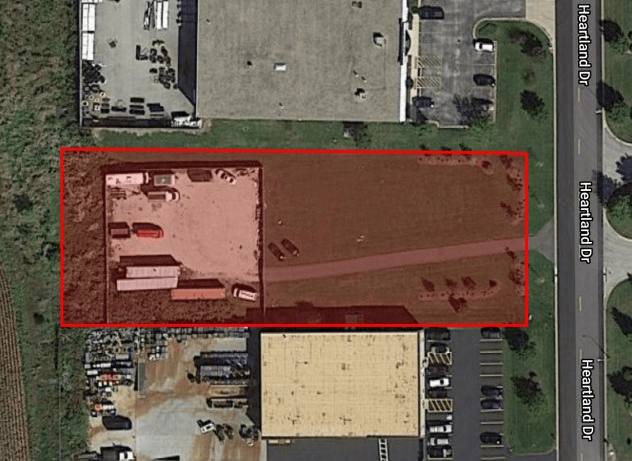
1-Mile | 3-Miles | 5-Miles | ||
---|---|---|---|---|
Total Population | 702 | 10,279 | 29,225 | |
Population Median Age | 42 | 42 | 39 | |
Population by Age | 0-9 Yrs | 113 (16%) | 1254 (12%) | 3586 (12%) |
10-19 Yrs | 66 (9%) | 1351 (13%) | 4543 (15%) | |
20-29 Yrs | 31 (4%) | 793 (7%) | 2654 (9%) | |
30-39 Yrs | 108 (15%) | 1157 (11%) | 3513 (12%) | |
40-49 Yrs | 70 (9%) | 1222 (11%) | 4750 (16%) | |
50-59 Yrs | 92 (13%) | 1390 (13%) | 3939 (13%) | |
60-69 Yrs | 140 (19%) | 1608 (15%) | 3485 (11%) | |
70+ Yrs | 83 (11%) | 1503 (14%) | 2754 (9%) | |
Median HH Income | $109,925 | $105,903 | $106,970 | |
Total Household Income | < 24K | 59 (21%) | 348 (9%) | 752 (7%) |
25-49K | 8 (2%) | 428 (11%) | 1256 (12%) | |
50-74K | 35 (12%) | 514 (13%) | 1264 (12%) | |
75-99K | 24 (8%) | 491 (12%) | 1482 (14%) | |
100-199K | 93 (33%) | 1490 (39%) | 4324 (41%) | |
200K+ | 55 (20%) | 533 (14%) | 1335 (12%) | |
Highest Education Level | No Diploma | 15 | 253 | 968 |
Diploma or GED | 85 | 1481 | 4483 | |
Some College | 109 | 1432 | 4036 | |
Assoc. Degree | 49 | 571 | 1514 | |
Bachelors Degree | 174 | 2150 | 5339 | |
Higher Degree | 92 | 1324 | 3154 | |
Total Housing Units | 274 | 3,826 | 10,606 | |
--Owner-Occupied | 236 | 3,563 | 9,134 | |
--Renter-Occupied | 38 | 241 | 1,280 | |
Owner-Occupied Values | < 100K | 0 | 46 | 180 |
100-199K | 20 | 611 | 1774 | |
200-299K | 63 | 1047 | 3641 | |
300-399K | 86 | 1501 | 2795 | |
400-499K | 19 | 195 | 473 | |
500K+ | 49 | 162 | 271 | |
Total Working Age Population | 559 | 8,245 | 22,703 | |
In Work Force | 349 | 4,814 | 15,490 | |
Not In Work Force | 210 | 3,431 | 7,213 | |
Workforce Employed | 323 | 4,634 | 15,093 | |
Workforce Unemployed | 26 | 180 | 397 | |
Civlian Workforce | 349 | 4,814 | 15,490 | |
Military Workforce | 0 | 0 | 0 | |
Total Households | 274 | 3,805 | 10,414 | |
Family Households | 195 | 2,783 | 7,570 | |
Non-Family Households | 79 | 1,021 | 2,844 | |
Married Couple | 188 | 2,499 | 6,439 | |
Other Family | 8 | 284 | 1,131 | |
Married w/Child | 77 | 966 | 2,920 | |
Single Male w/Child | 0 | 45 | 255 | |
Single Female w/Child | 8 | 90 | 284 |
Population Change Last Two Decades - Plus Projection
2000 | % | 2010 | % | 2020 | % | 2030 | |
---|---|---|---|---|---|---|---|
Illinois | 12,419,293 | +3 | 12,830,632 | +12 | 14,316,487 | +6 | 15,138,849 |
Kendall County | 54,544 | +110 | 114,736 | -31 | 78,694 | +8 | 85,060 |
Kane County | 404,119 | +28 | 515,269 | +22 | 630,563 | +8 | 679,403 |
Total Working Age Population:
Total Households:
Total Working Age Population:
Total Households:
Total Working Age Population:
Total Households: