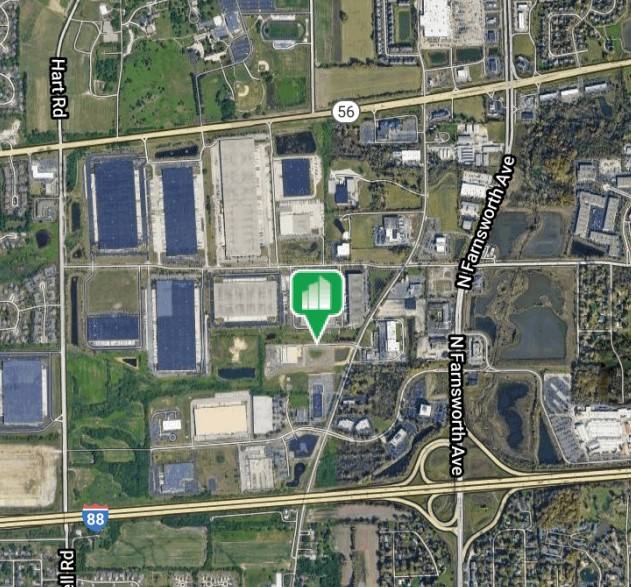
Commercial Land
Church and Hoops Aurora, IL 60502
Church and Hoops Aurora, IL 60502
Details & Description
Property Highlights
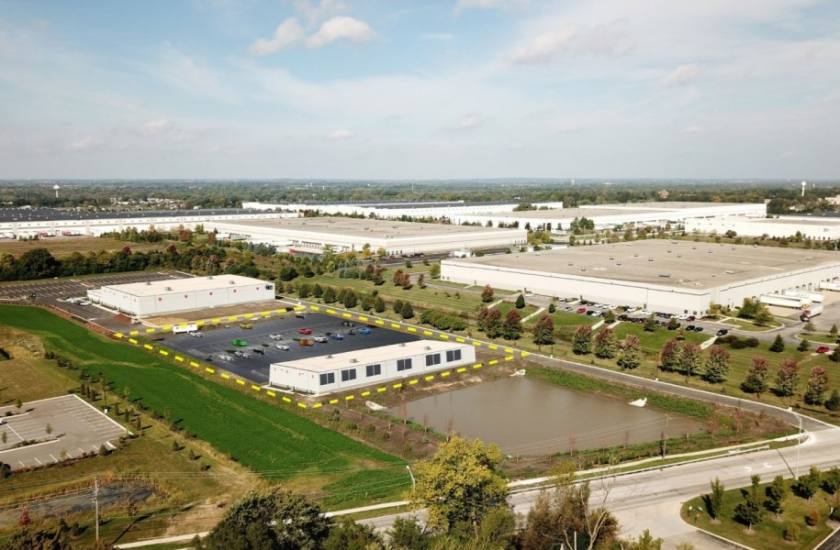
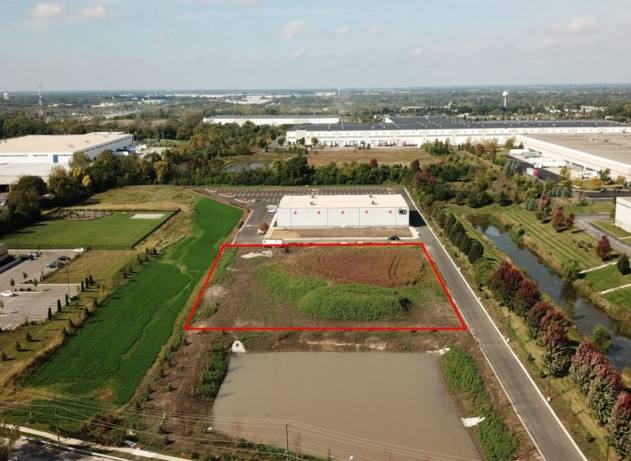
• Ideal Office/Industrial Condominium development site
• Zoned: Office/Research/Industrial (ORI)
Listing Agents

J.D. Dolan
O: 630-801-8800
M: 630-272-2134
jd.dolanmurphyteam@catoncommercial.com
O: 630-801-8800
M: 630-272-2134
jd.dolanmurphyteam@catoncommercial.com
While we strive to provide the most accurate information, all listing information, and demographic data, is provided by third-parties. As such, MyEListing will not be responsible for the accuracy of the information. It is strongly recommended that you verify all information with the listing agent, and any relevant agencies, prior to making any decisions.