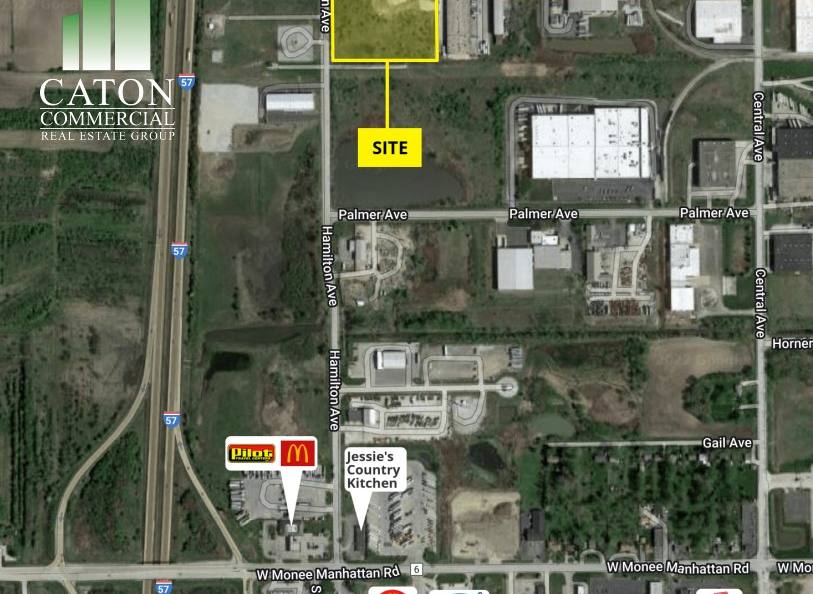
Commercial Land
NEC Central Ave and Stuenkel Rd University Park, IL 60484
NEC Central Ave and Stuenkel Rd University Park, IL 60484
Details & Description
Property Highlights
- • All utilities stubbed to property
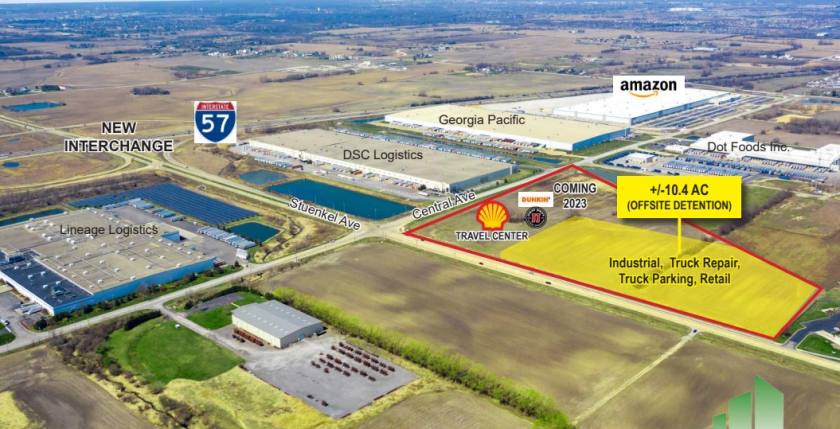
- • Detention provided for
- • One block off I-57 interchange
- • All truck related uses are approved
Additional Photos


Listing Agents

Brian Blackmore
O: 815-436-5700
M: 630-207-8292
brian@catoncommercial.com
O: 815-436-5700
M: 630-207-8292
brian@catoncommercial.com
While we strive to provide the most accurate information, all listing information, and demographic data, is provided by third-parties. As such, MyEListing will not be responsible for the accuracy of the information. It is strongly recommended that you verify all information with the listing agent, and any relevant agencies, prior to making any decisions.


