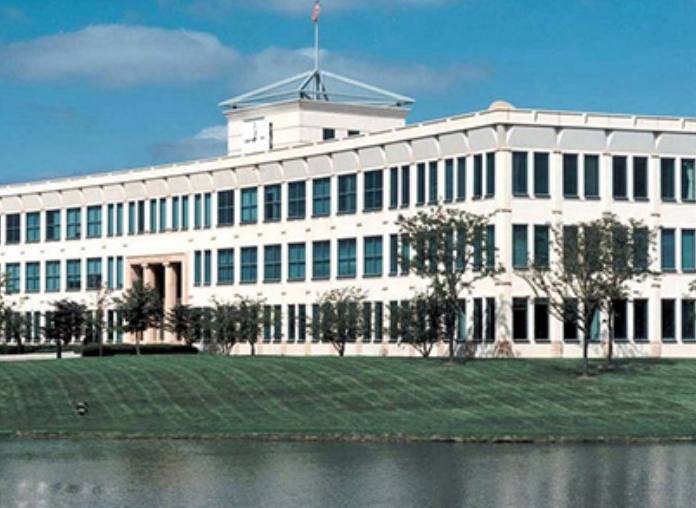
Office Space
100 and 150 N Field Dr Lake Forest, IL 60045
100 and 150 N Field Dr Lake Forest, IL 60045
Details & Description
Property Highlights
- • Building Size: 105,000 SF
- • 35,000 SF floor plates
- • Amenities:Atrium
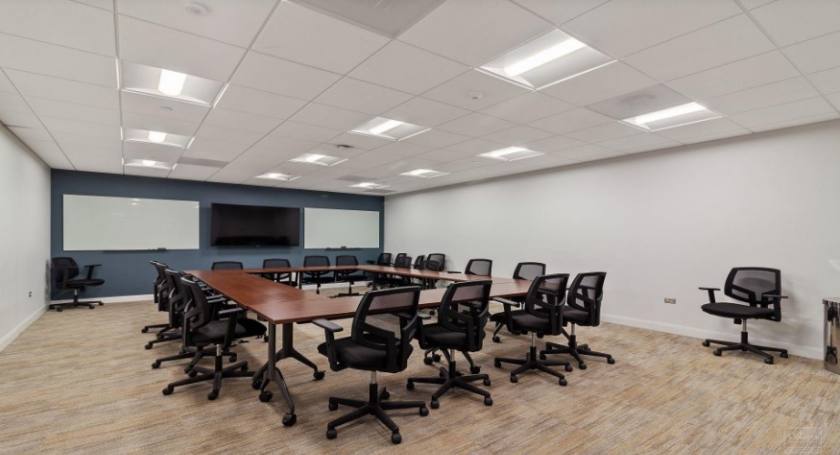
- • Conference Facility
- • Fitness Center
- • Food Service
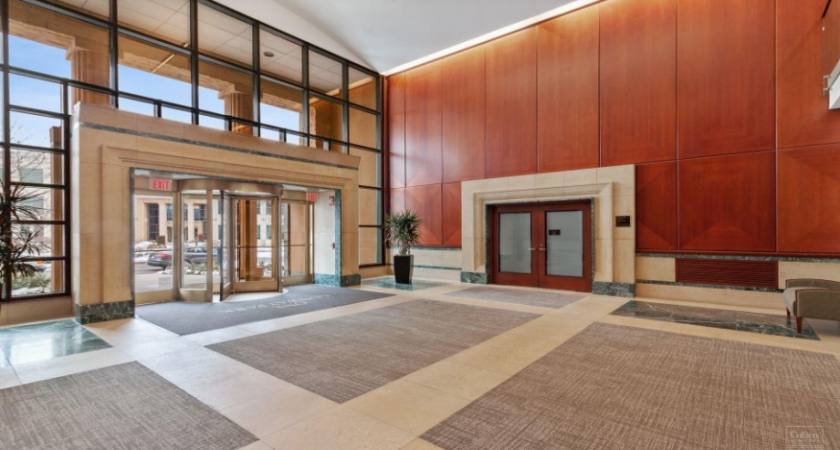
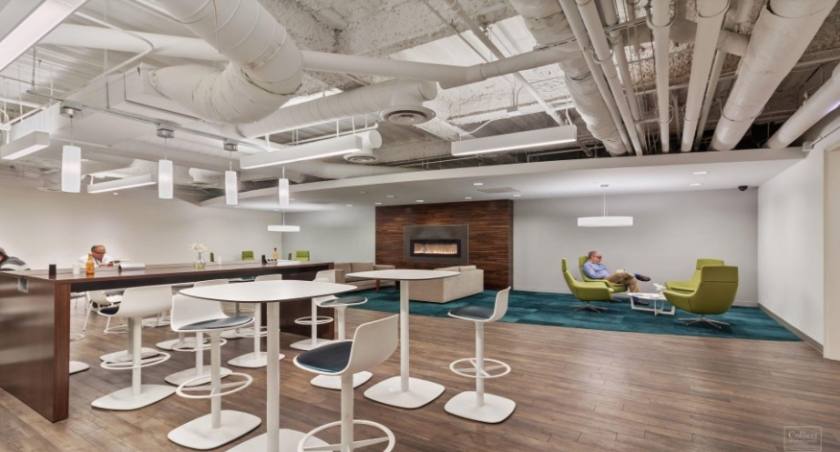
Additional Photos

Listing Agents

Jonathon Connor
O: 847-698-8246
M: 847-436-6664
jonathon.connor@colliers.com
O: 847-698-8246
M: 847-436-6664
jonathon.connor@colliers.com
While we strive to provide the most accurate information, all listing information, and demographic data, is provided by third-parties. As such, MyEListing will not be responsible for the accuracy of the information. It is strongly recommended that you verify all information with the listing agent, and any relevant agencies, prior to making any decisions.


