Retail Space
7021 South Vermont Avenue Los Angeles, CA 90044
7021 South Vermont Avenue Los Angeles, CA 90044
Details & Description
Property Highlights
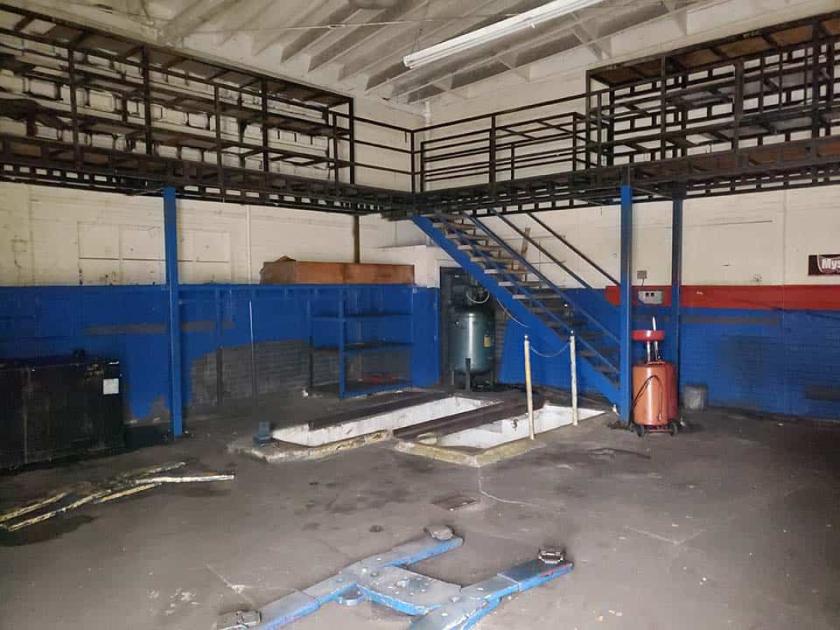
- • Large Automotive Center
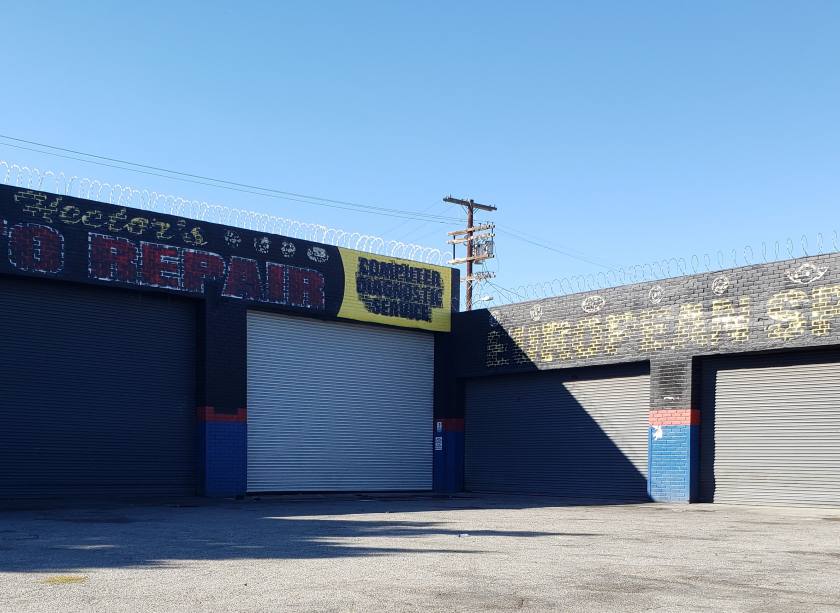
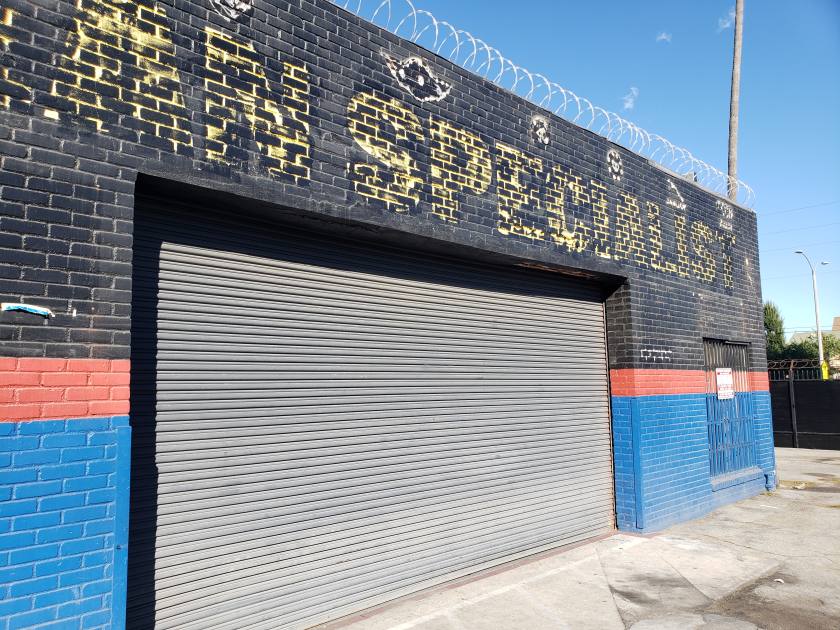
- • Street Frontage Visibility
- • Minutes to Downtown Los Angeles
- • Secured Gated Property
- • Conveniently near the 110 & 10 Freeways
Additional Photos


Listing Agents

Mike Tolj
O: 323-258-4946
M: 323-317-2561
mike@toljcommercial.com
O: 323-258-4946
M: 323-317-2561
mike@toljcommercial.com
While we strive to provide the most accurate information, all listing information, and demographic data, is provided by third-parties. As such, MyEListing will not be responsible for the accuracy of the information. It is strongly recommended that you verify all information with the listing agent, and any relevant agencies, prior to making any decisions.