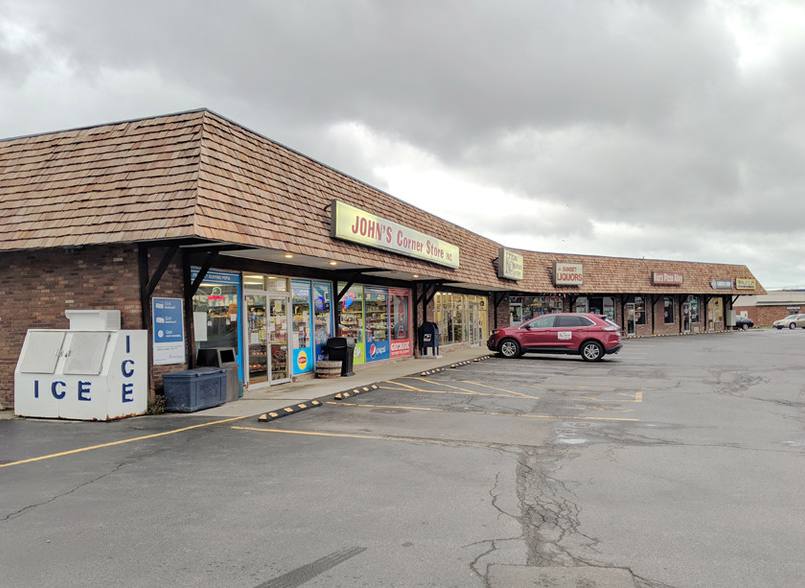
Retail Space
5440 Camp Road Hamburg, NY 14075
5440 Camp Road Hamburg, NY 14075
Details & Description
Property Highlights
- • 3,700+/- SF Convenience Store
- • High Traffic Count 21,672+/- AADT
- • Central Location
- • Plenty of Parking
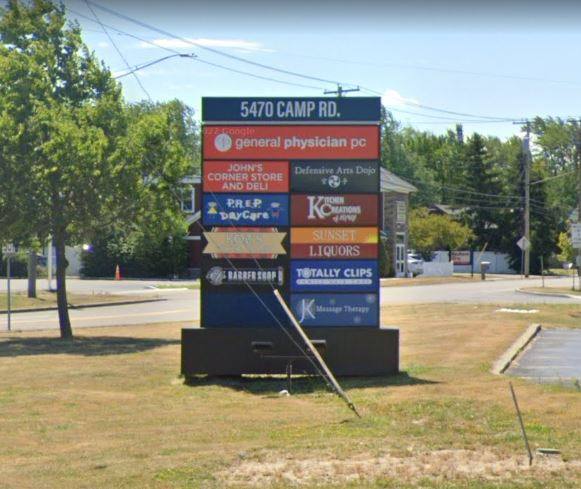
Additional Photos


Listing Agents

Rick Recckio
O: 716-631-5555
M: 716-998-4422
rick@recckio.com
O: 716-631-5555
M: 716-998-4422
rick@recckio.com
While we strive to provide the most accurate information, all listing information, and demographic data, is provided by third-parties. As such, MyEListing will not be responsible for the accuracy of the information. It is strongly recommended that you verify all information with the listing agent, and any relevant agencies, prior to making any decisions.


