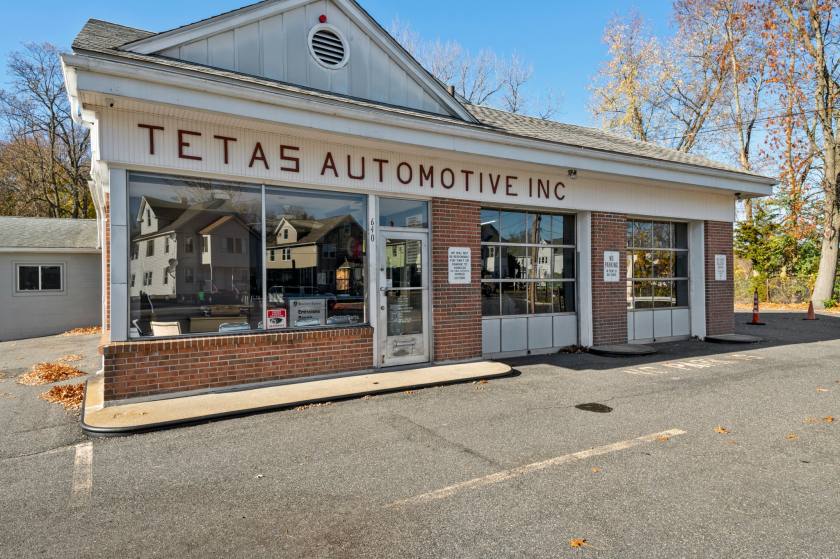
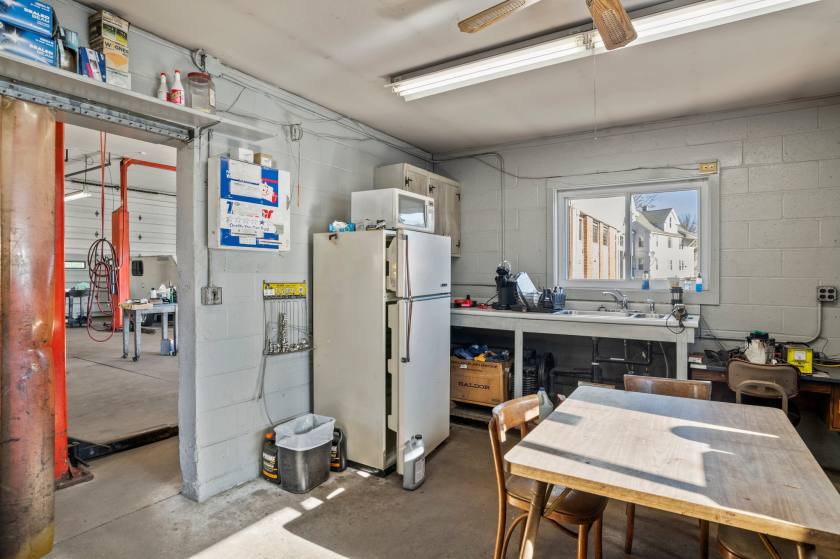
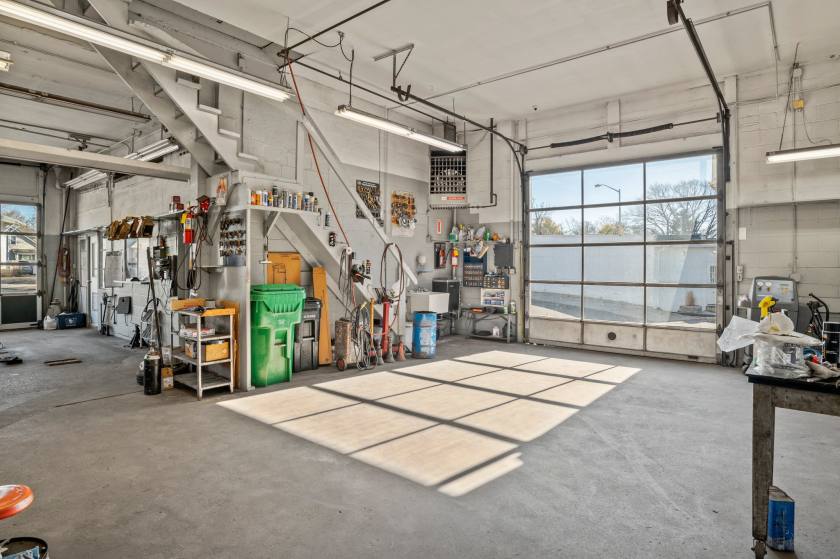
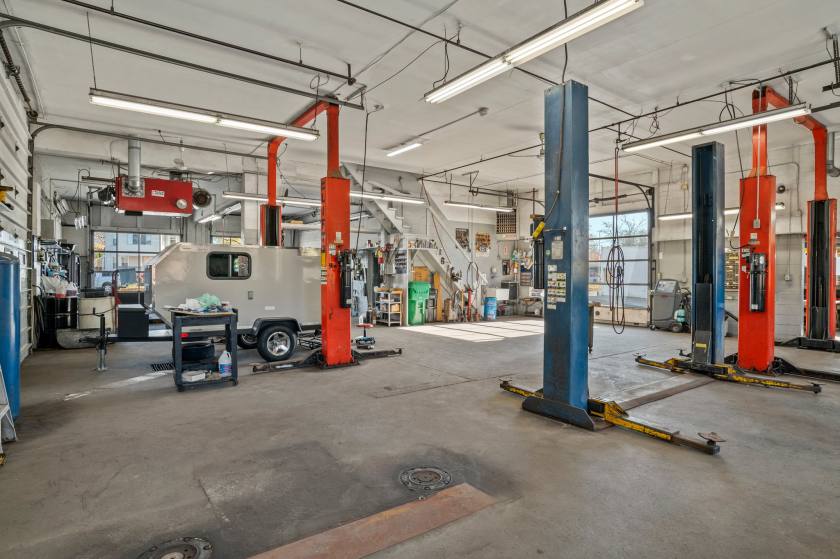
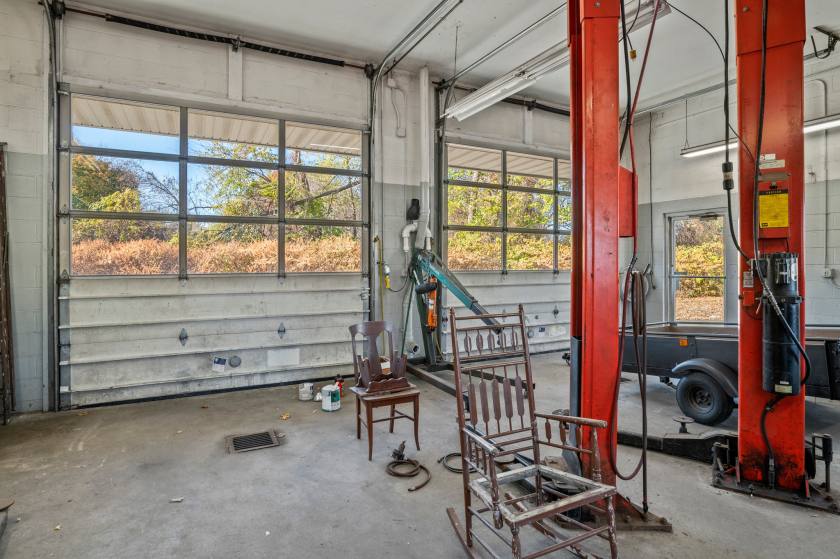
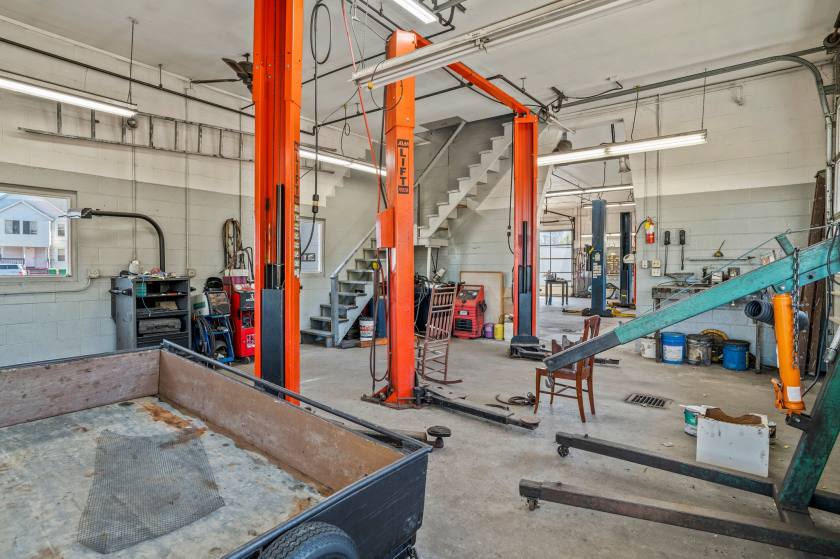
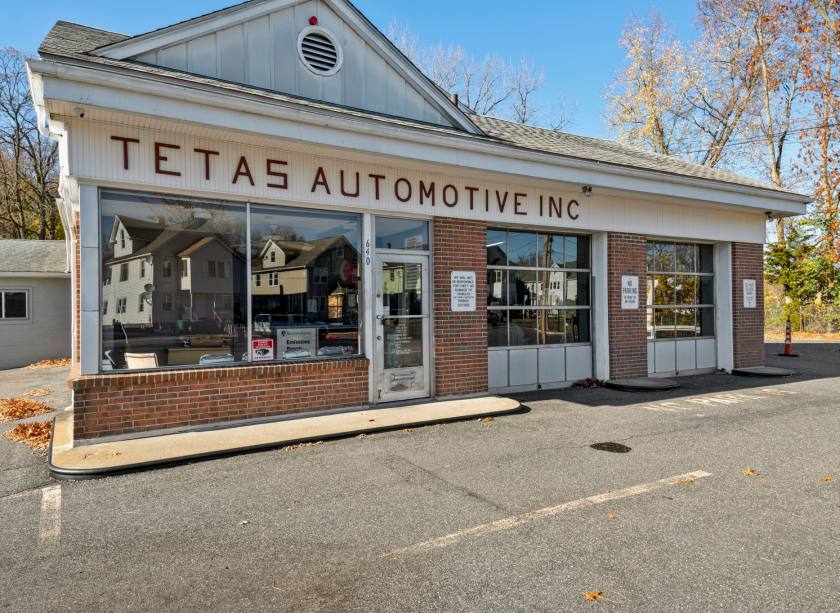
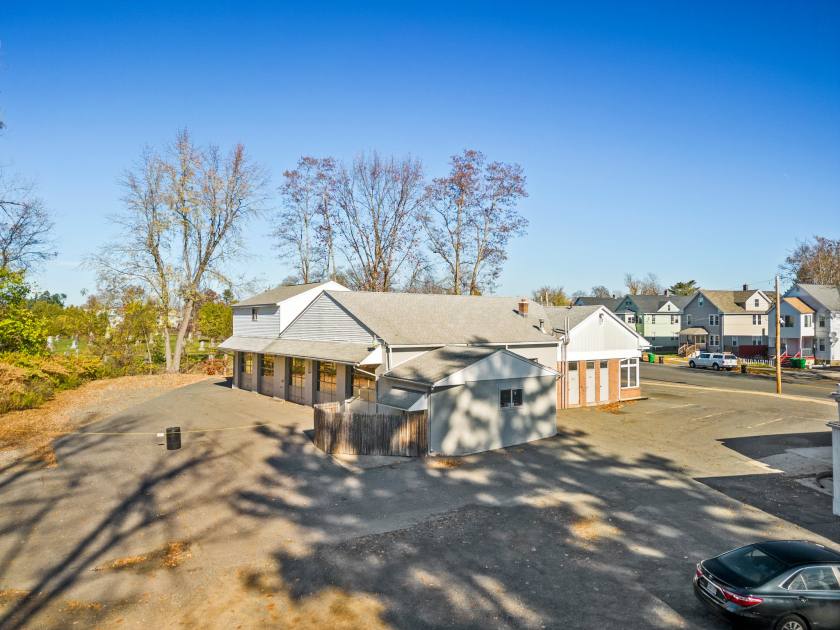
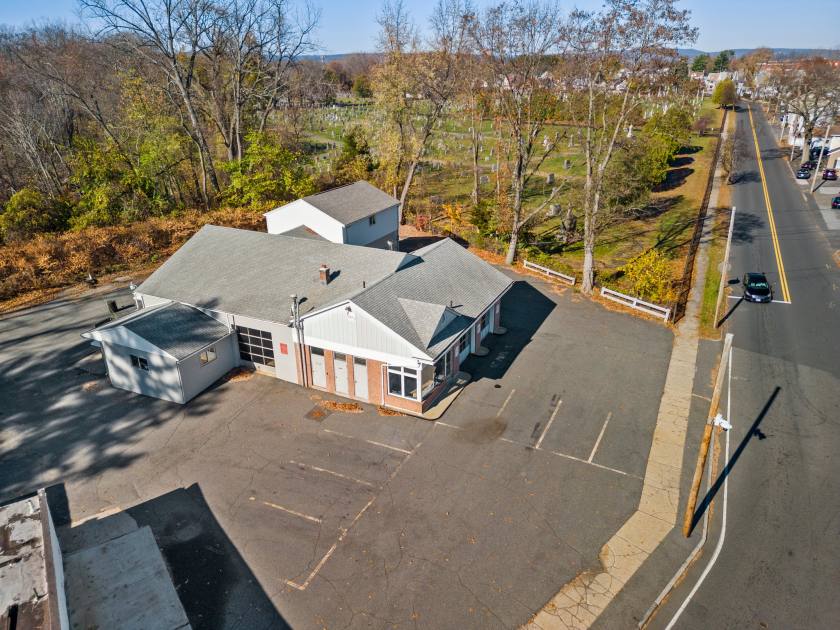
Retail Space
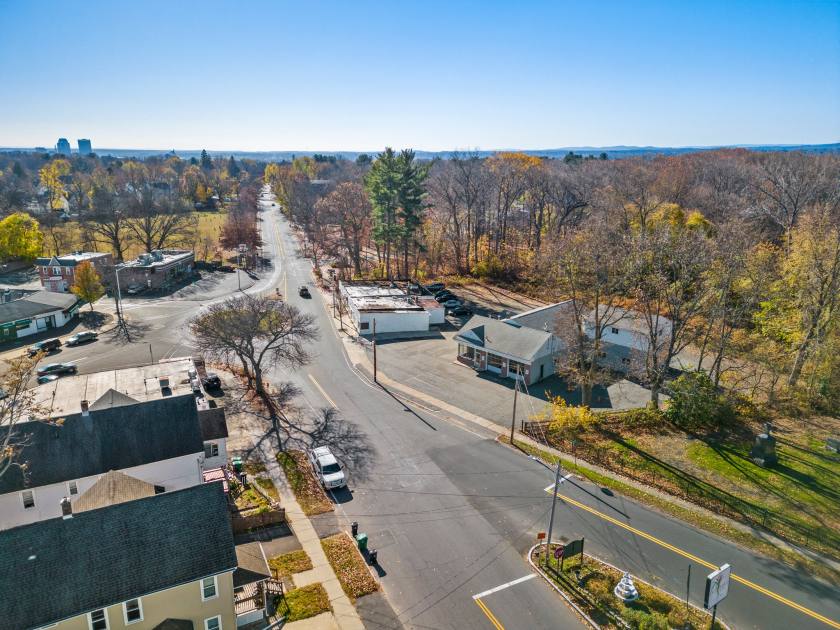
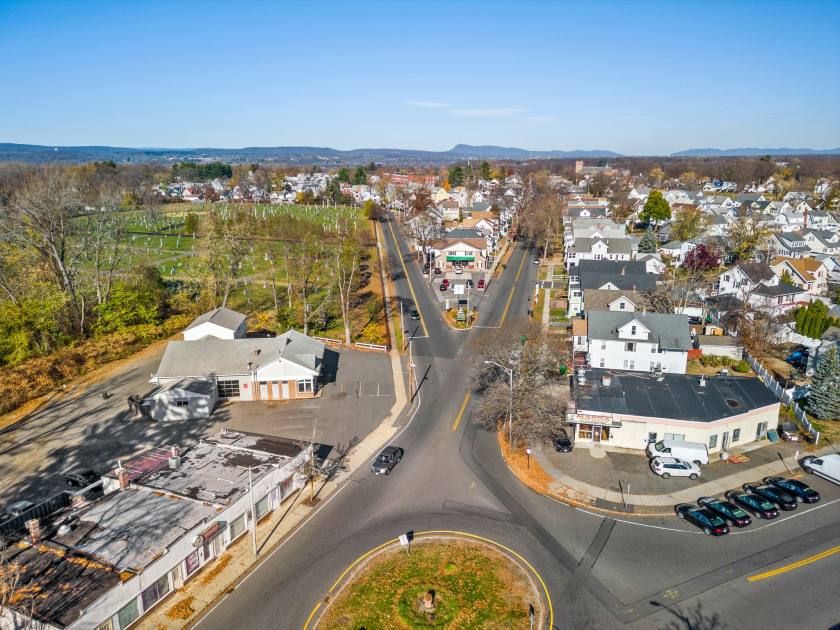
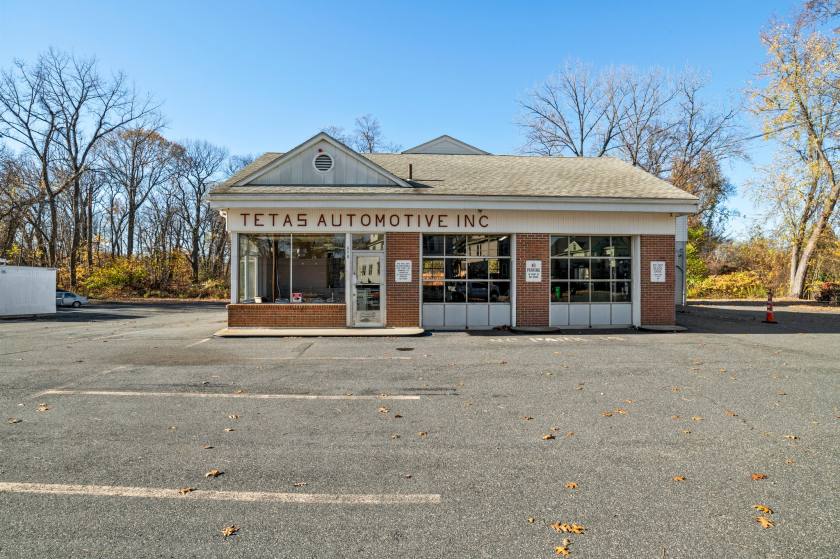
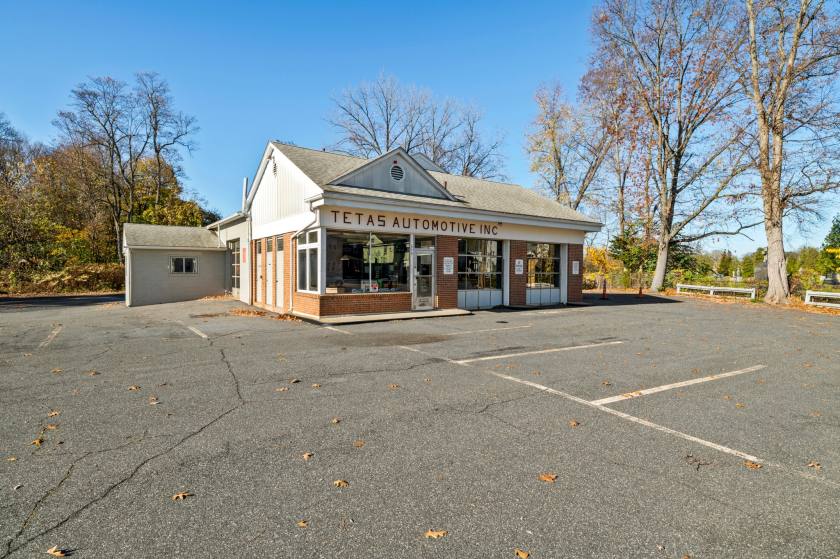
640 Springfield Street Chicopee, MA 01013
640 Springfield Street Chicopee, MA 01013
Details & Description
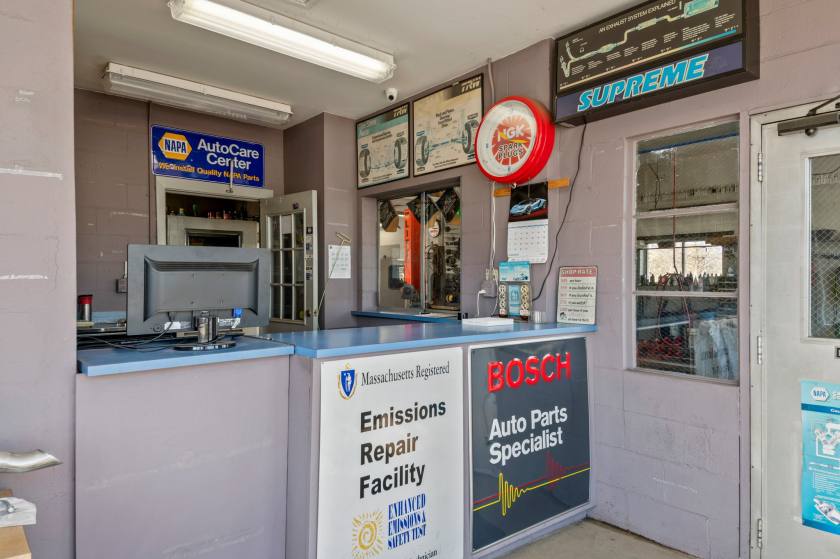
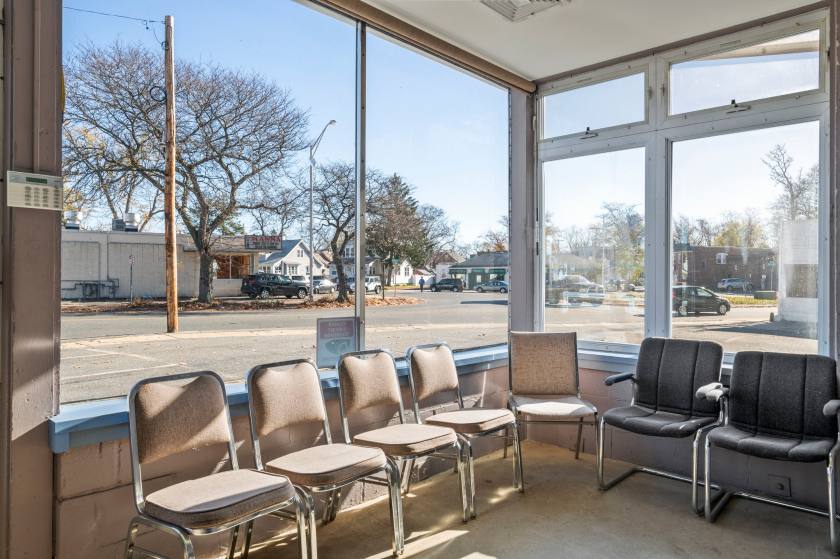
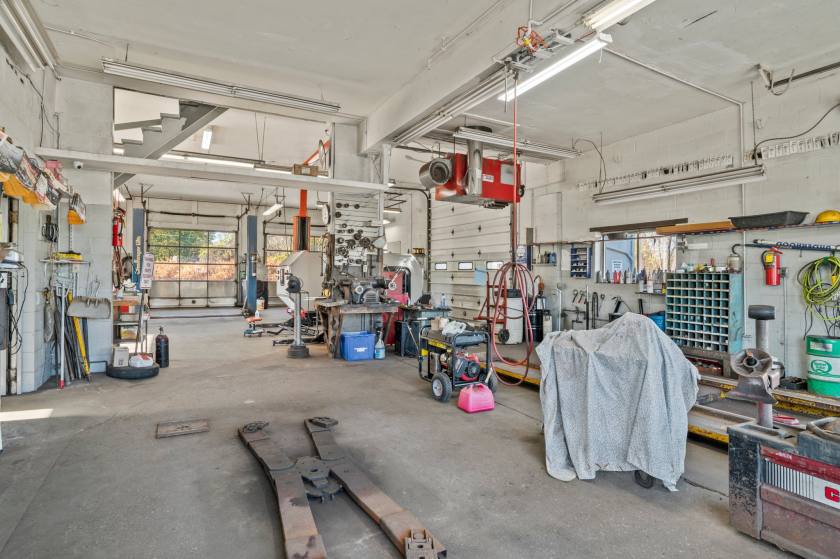
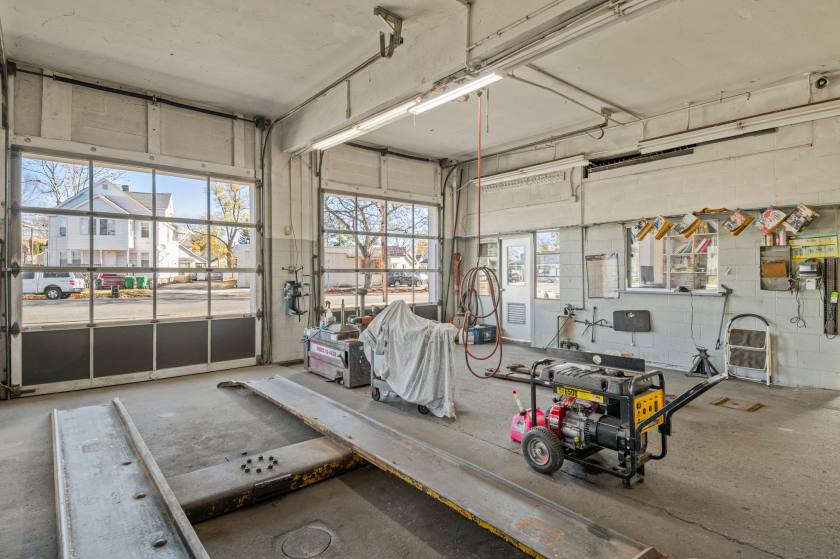
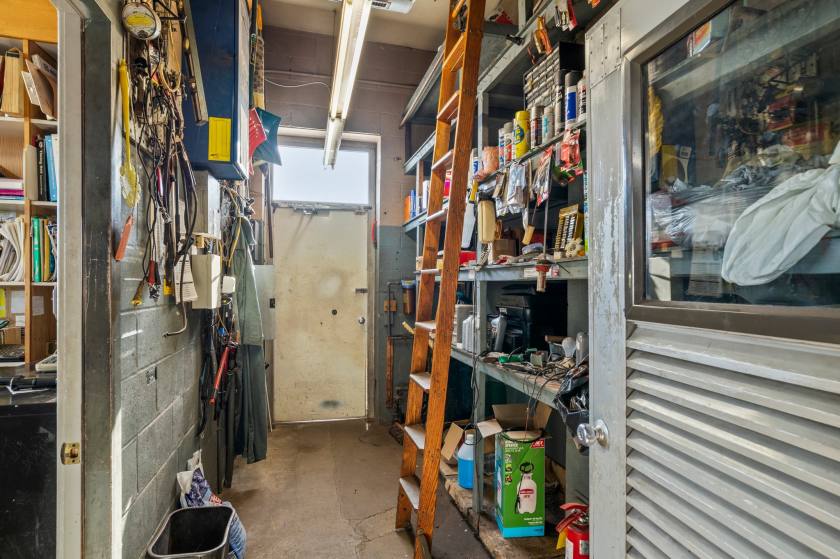
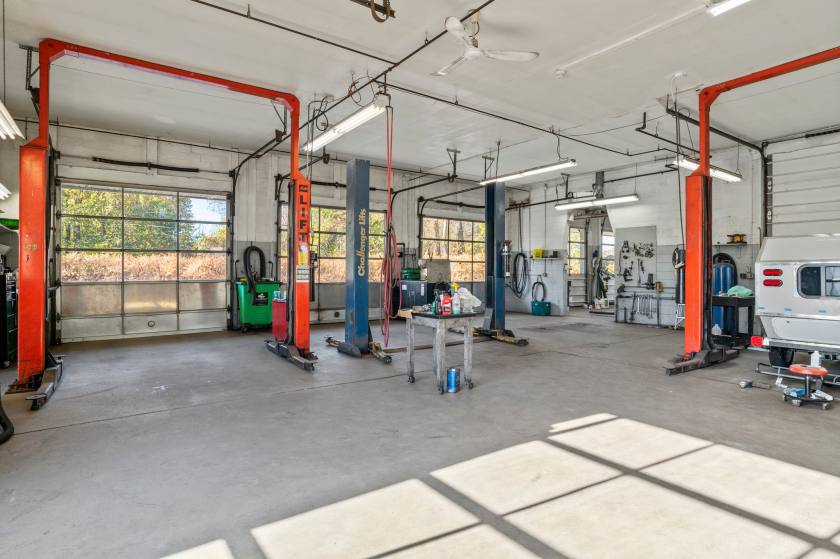
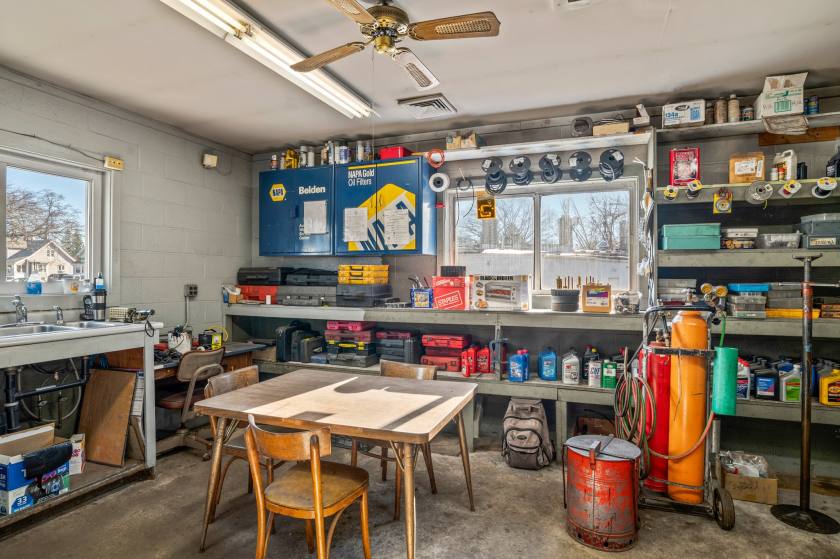
Additional Photos


Listing Agents

Paul Bongiorni
M: 413-459-0570
pbongiorni.re@gmail.com
M: 413-459-0570
pbongiorni.re@gmail.com
While we strive to provide the most accurate information, all listing information, and demographic data, is provided by third-parties. As such, MyEListing will not be responsible for the accuracy of the information. It is strongly recommended that you verify all information with the listing agent, and any relevant agencies, prior to making any decisions.