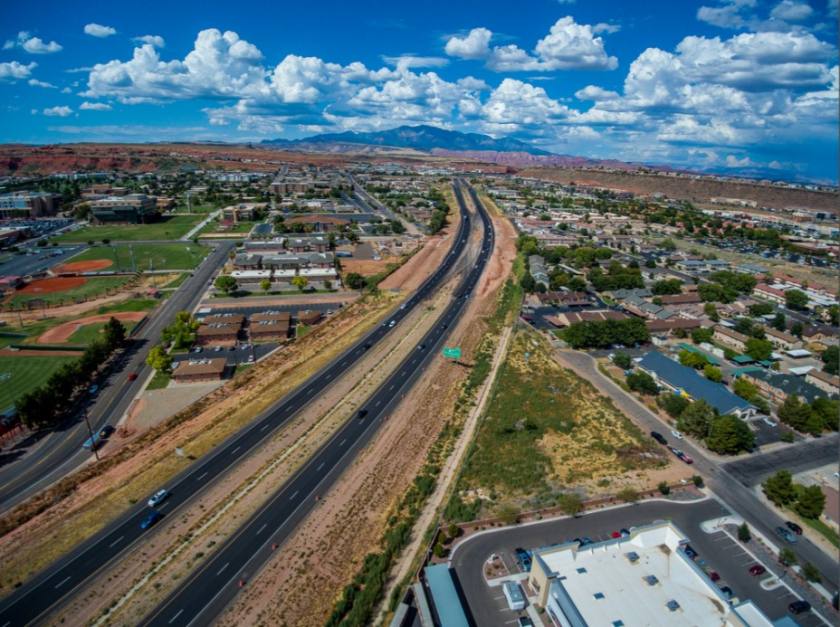
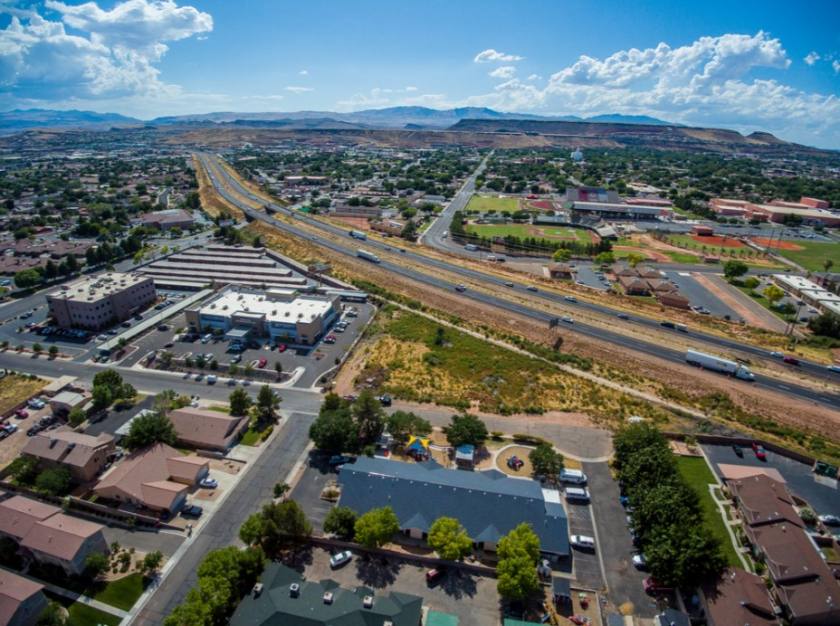
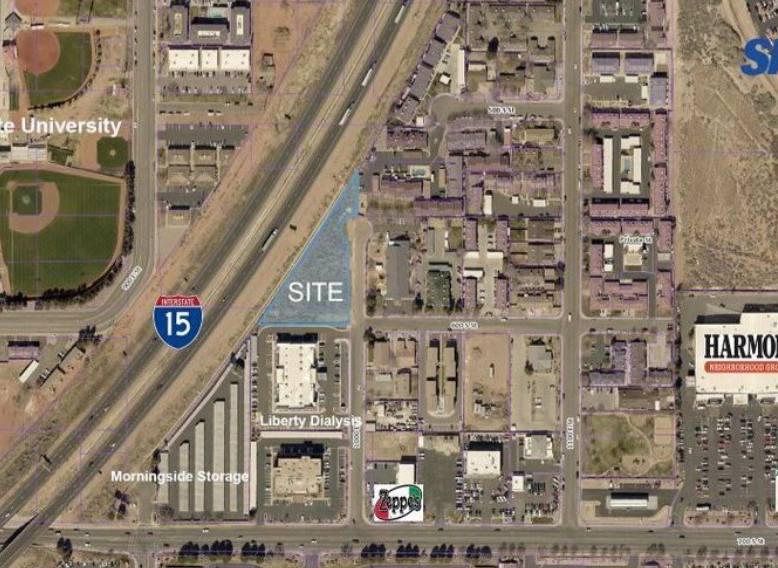
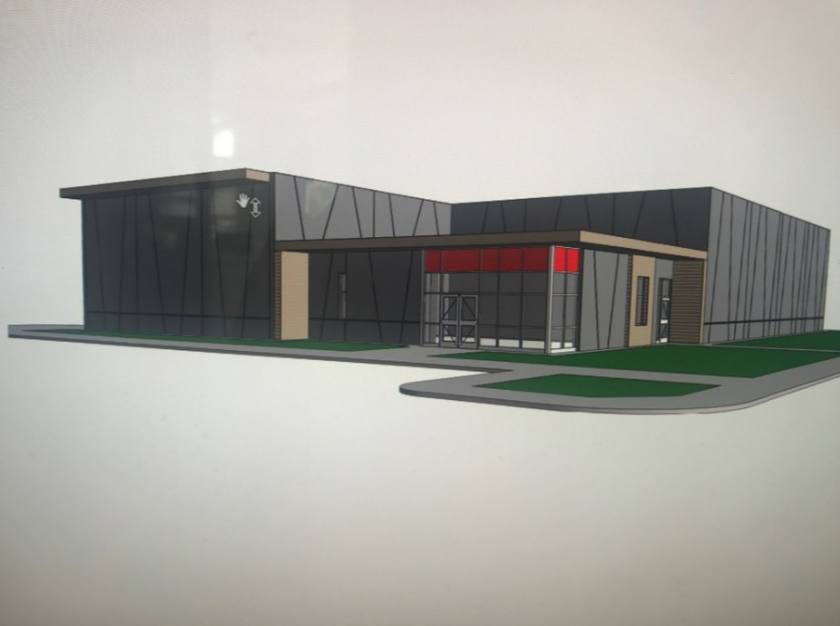
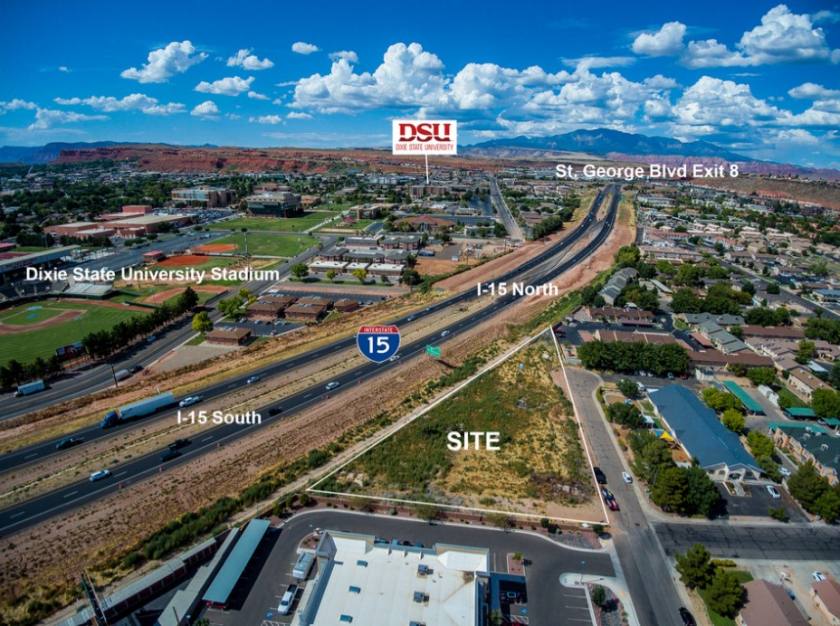
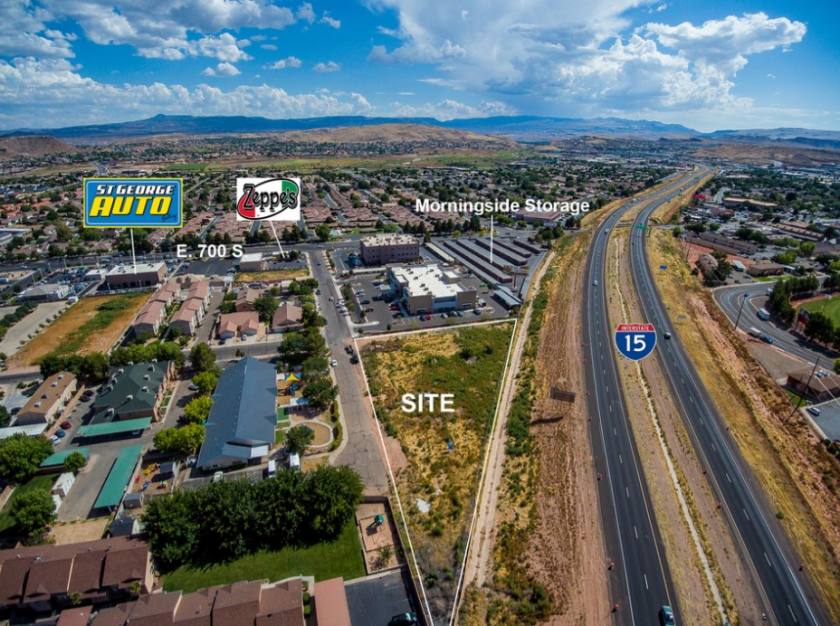
Commercial Land
590 South 1000 East St George, UT 84790
590 South 1000 East St George, UT 84790
Details & Description
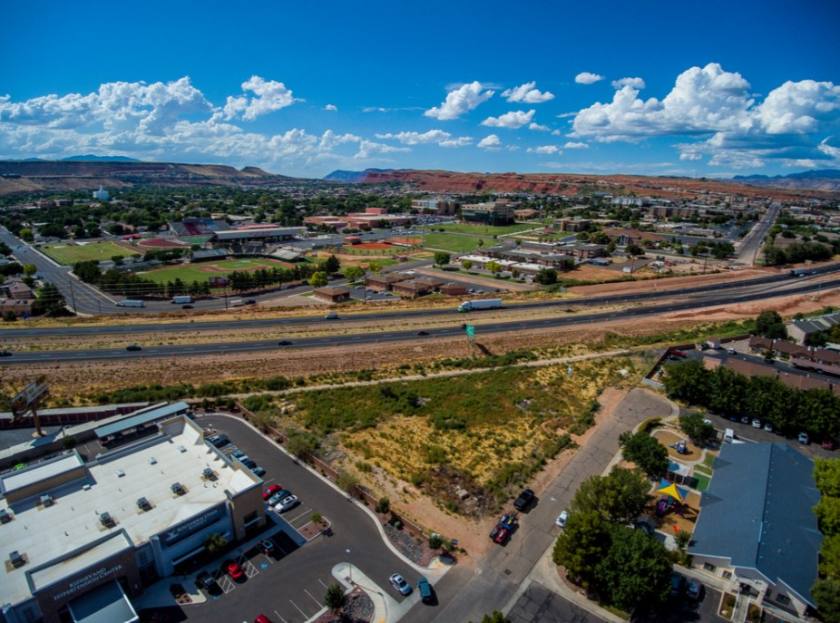
Additional Photos
Listing Agents

Tom Callister
O: 435-359-4902
tom@linxcre.com
O: 435-359-4902
tom@linxcre.com
While we strive to provide the most accurate information, all listing information, and demographic data, is provided by third-parties. As such, MyEListing will not be responsible for the accuracy of the information. It is strongly recommended that you verify all information with the listing agent, and any relevant agencies, prior to making any decisions.