Multifamily Housing
2810 Ebenezer Road Southeast Conyers, GA 30094
2810 Ebenezer Road Southeast Conyers, GA 30094
Details & Description
Property Highlights
- • Central location between Atlanta and Social Circle
- • Huge drive way for your RV, big truck or even bus
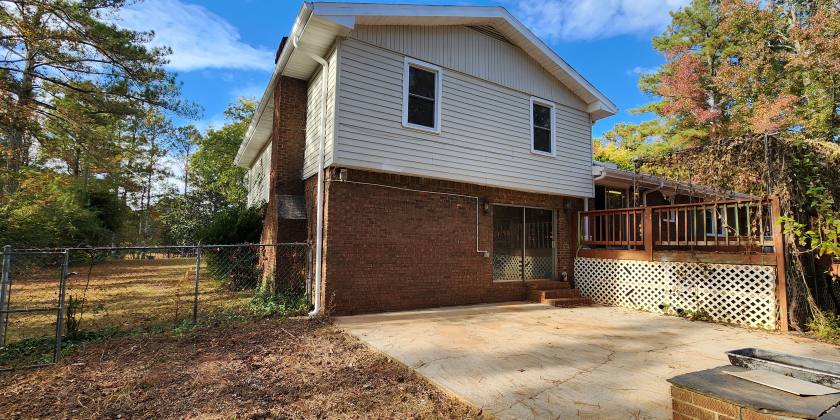
- • 2.4 acres lot enough to host a troop camp on it
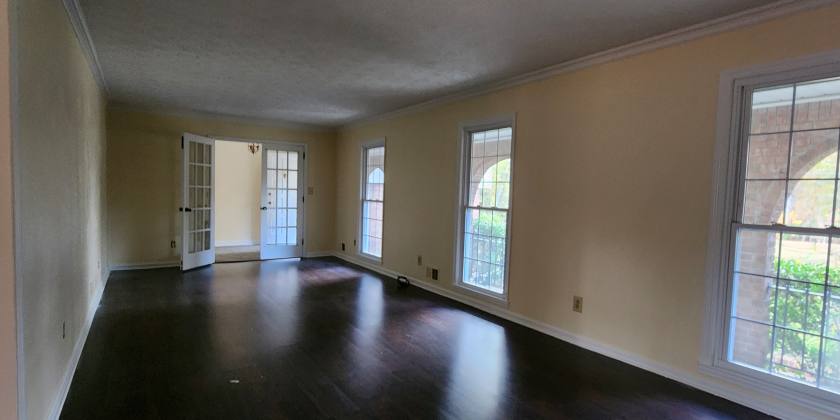
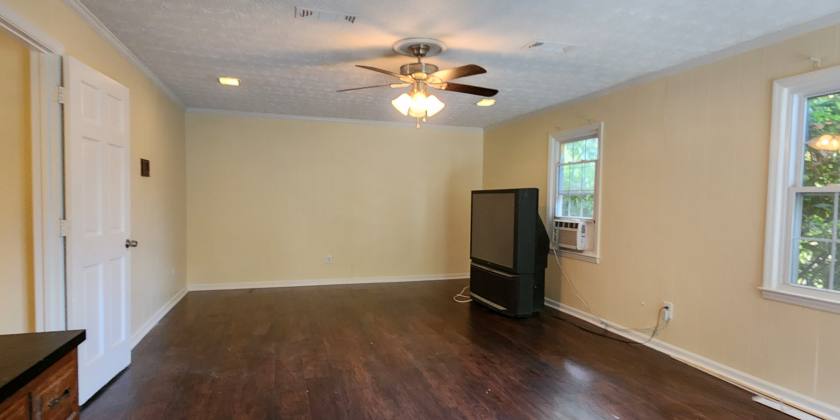
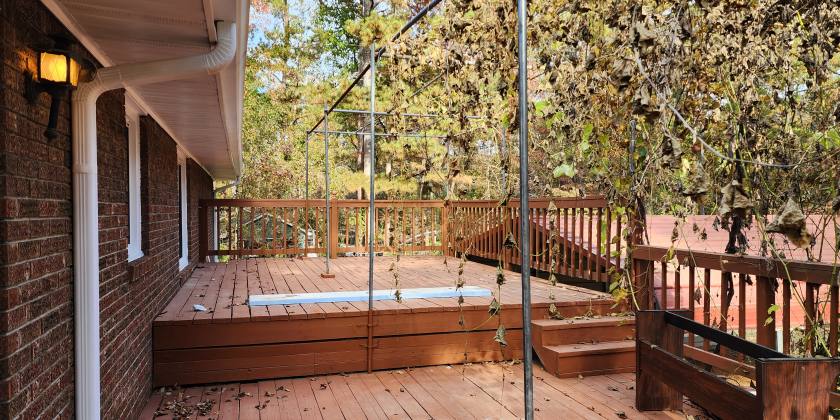
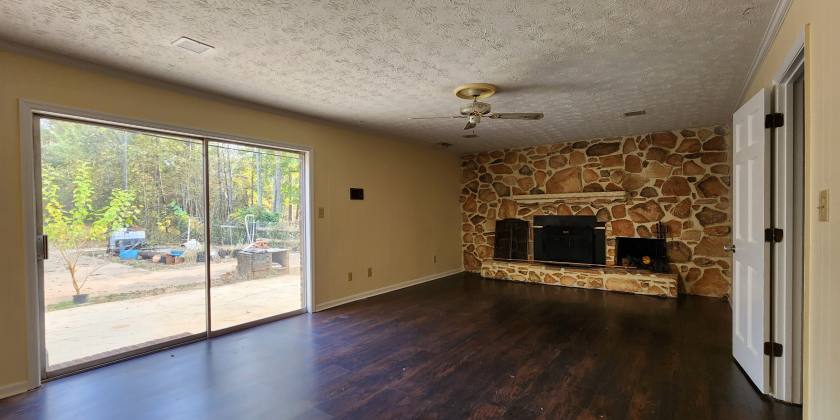
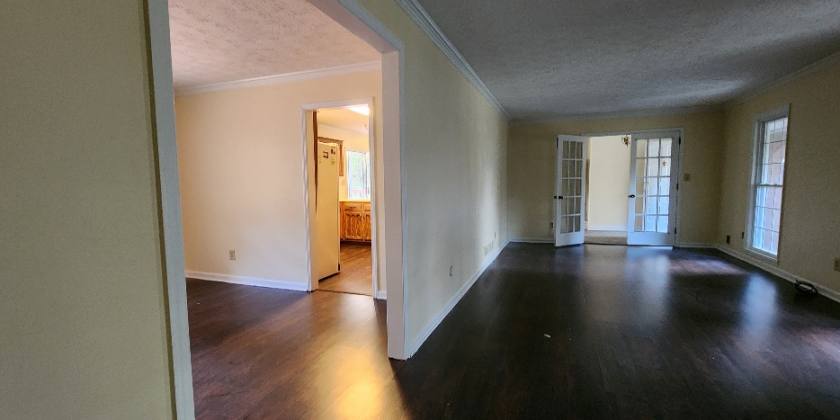
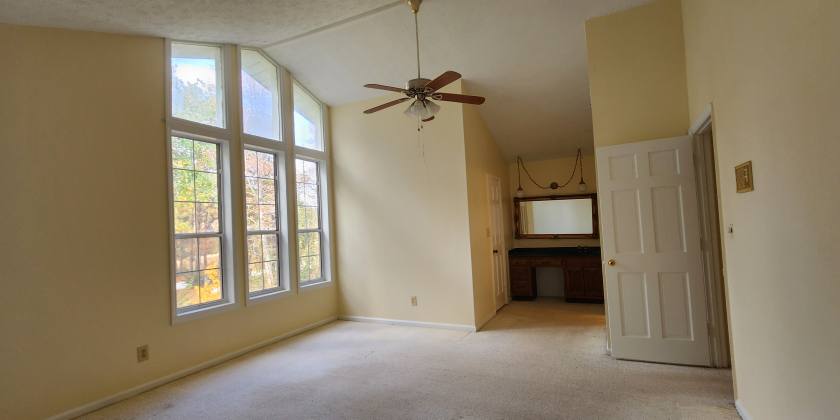
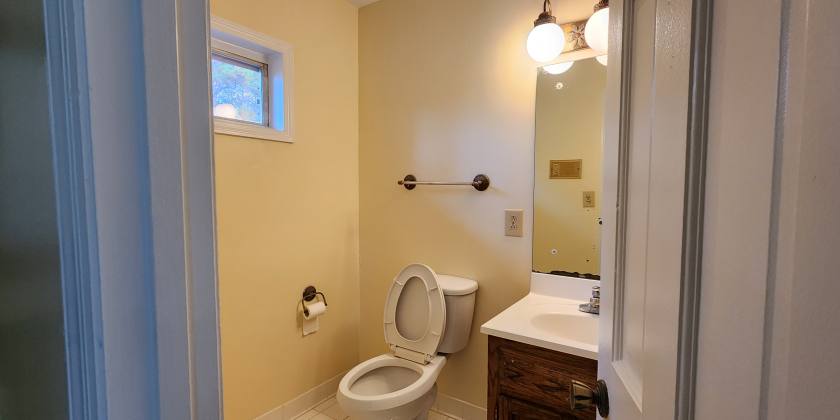
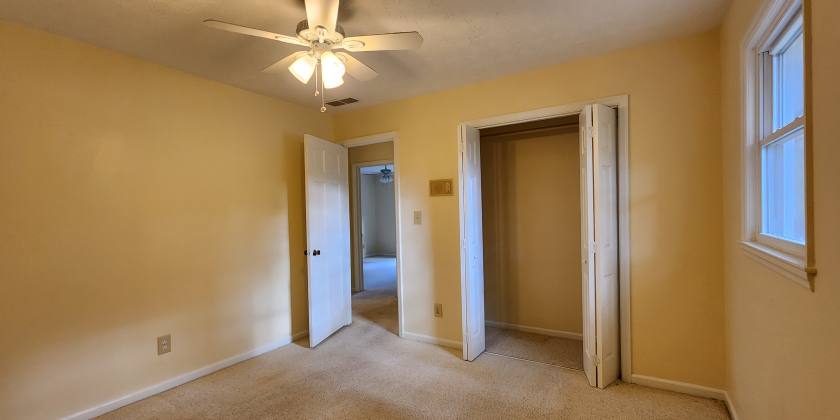
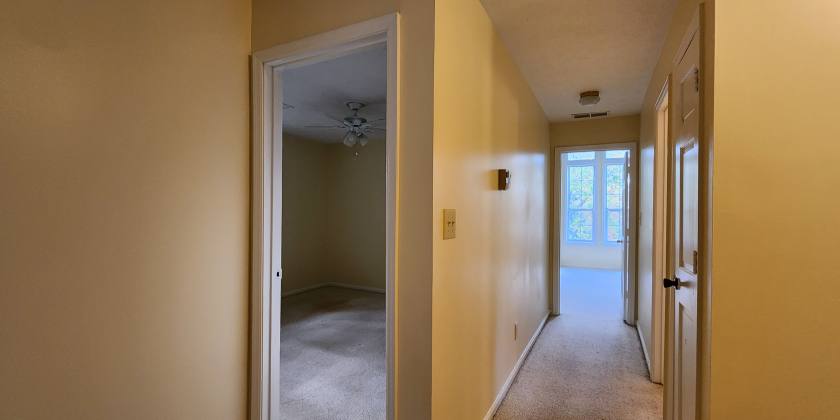
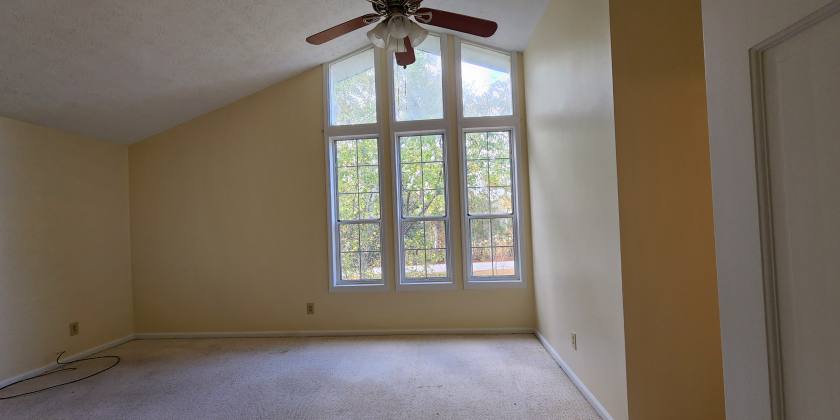
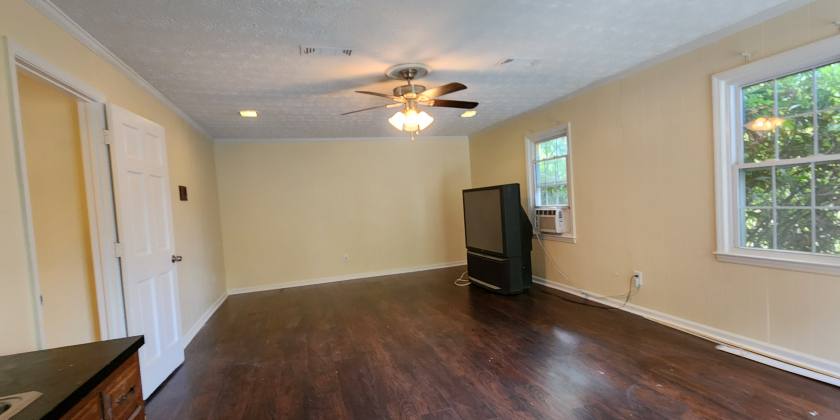
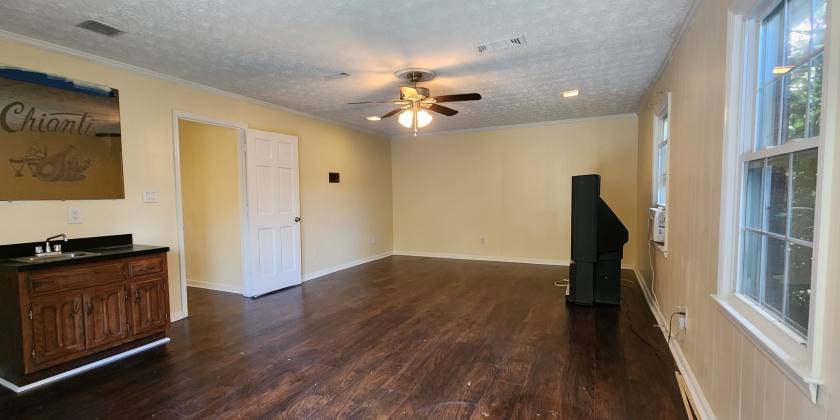
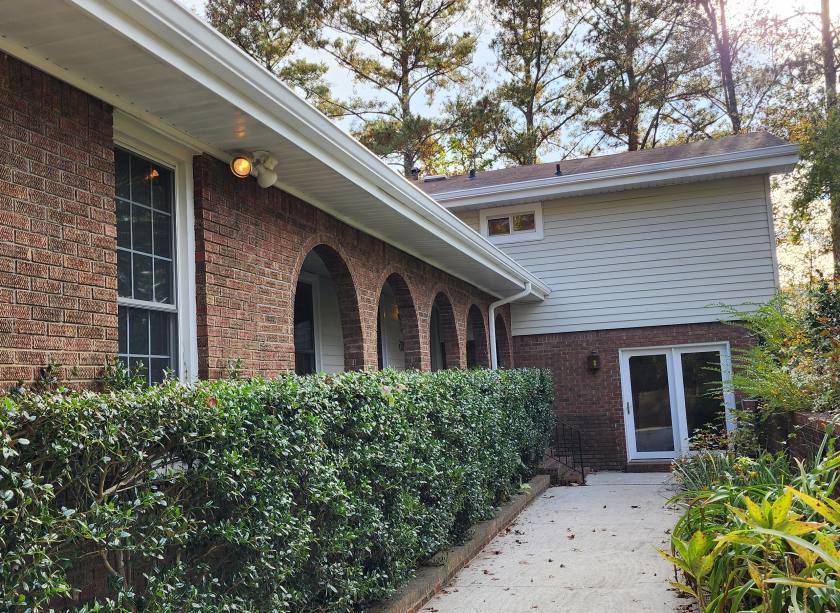
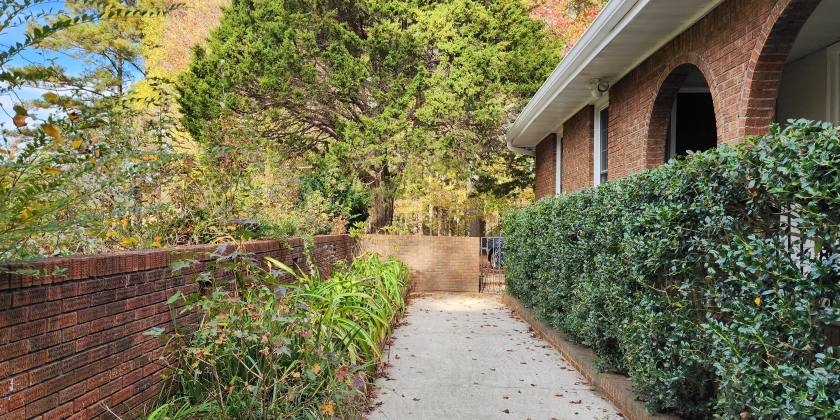
Additional Photos


Listing Agents

Azza Barhoma
BHHS
O: 404-944-1178
azza.barhoma@bhhsgeorgia.com
BHHS
O: 404-944-1178
azza.barhoma@bhhsgeorgia.com
While we strive to provide the most accurate information, all listing information, and demographic data, is provided by third-parties. As such, MyEListing will not be responsible for the accuracy of the information. It is strongly recommended that you verify all information with the listing agent, and any relevant agencies, prior to making any decisions.