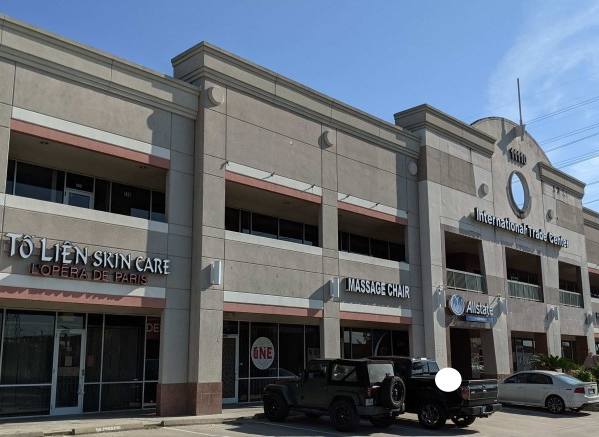
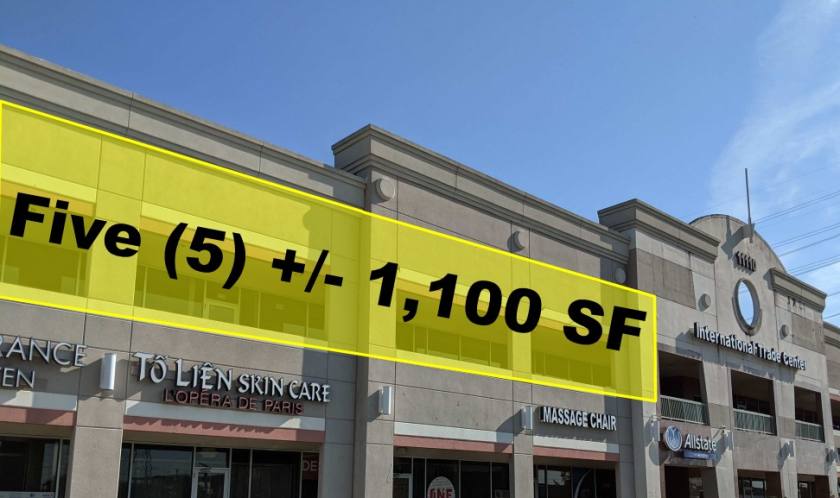
Office Space
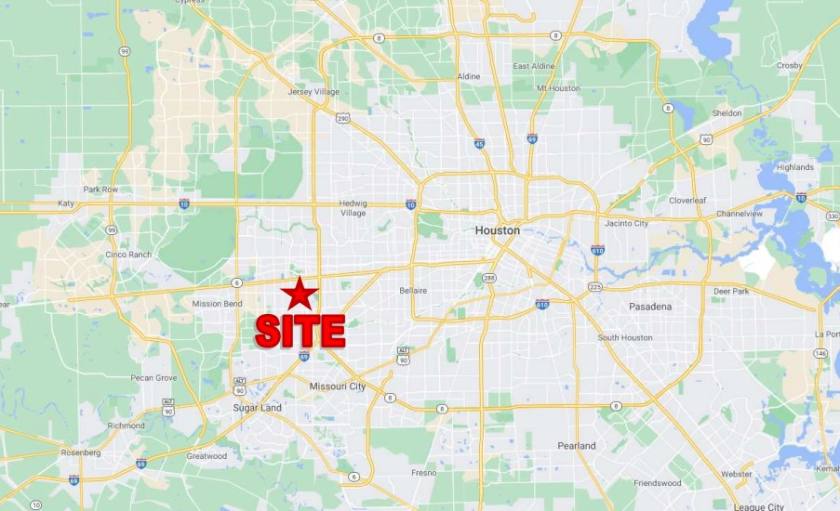
11110 Bellaire Boulevard Houston, TX 77072
11110 Bellaire Boulevard Houston, TX 77072
Details & Description
Property Highlights
- • Additional parking in rear
- • Seller financing available
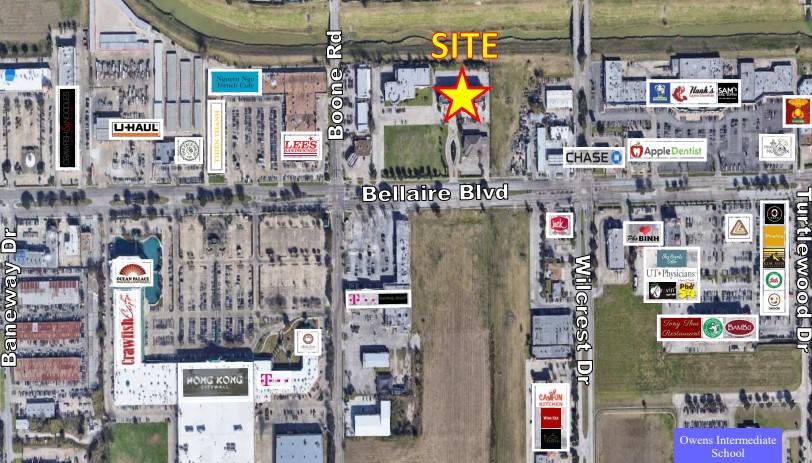
- • Accessible via two drive cuts on Bellaire Blvd
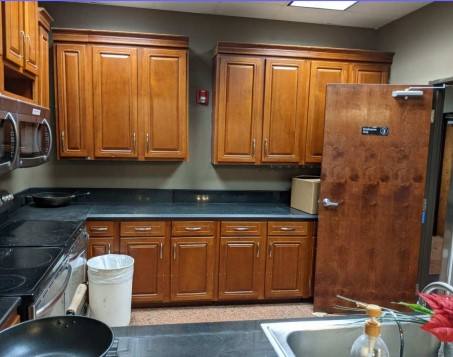
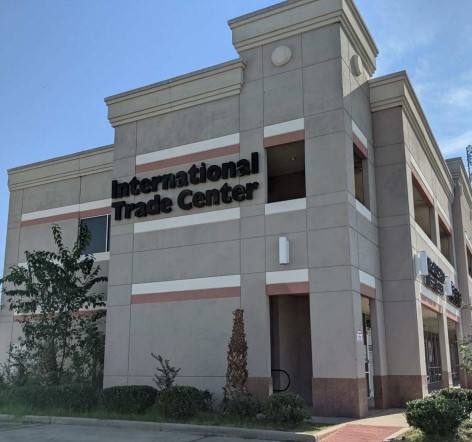
Additional Photos
Listing Agents

Danny Nguyen
O: 713-270-5400
M: 713-478-2972
dannynguyen@dncommercial.net
O: 713-270-5400
M: 713-478-2972
dannynguyen@dncommercial.net
While we strive to provide the most accurate information, all listing information, and demographic data, is provided by third-parties. As such, MyEListing will not be responsible for the accuracy of the information. It is strongly recommended that you verify all information with the listing agent, and any relevant agencies, prior to making any decisions.