Retail Space
11452 Springfield Pike Springdale, OH 45246
11452 Springfield Pike Springdale, OH 45246

Details & Description
Property Highlights
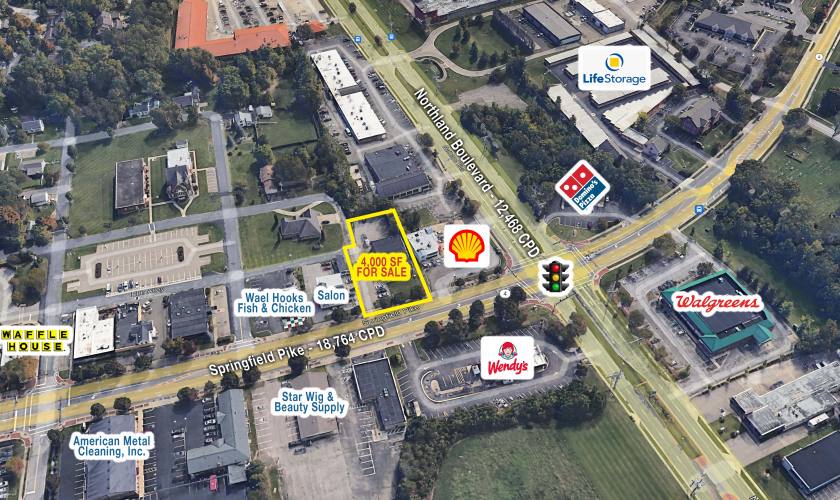
- • 4,000 sf Commercial Garage on .47 Acre
- • 5 Bays - 10' x 10' Doors
- • Strong Traffic and Population
- • PRICE REDUCED: $549,000
Additional Photos


Listing Agents

David Metz
O: 513-322-6302
M: 513-703-2204
dmetz@bergmancommercial.com
O: 513-322-6302
M: 513-703-2204
dmetz@bergmancommercial.com
While we strive to provide the most accurate information, all listing information, and demographic data, is provided by third-parties. As such, MyEListing will not be responsible for the accuracy of the information. It is strongly recommended that you verify all information with the listing agent, and any relevant agencies, prior to making any decisions.


