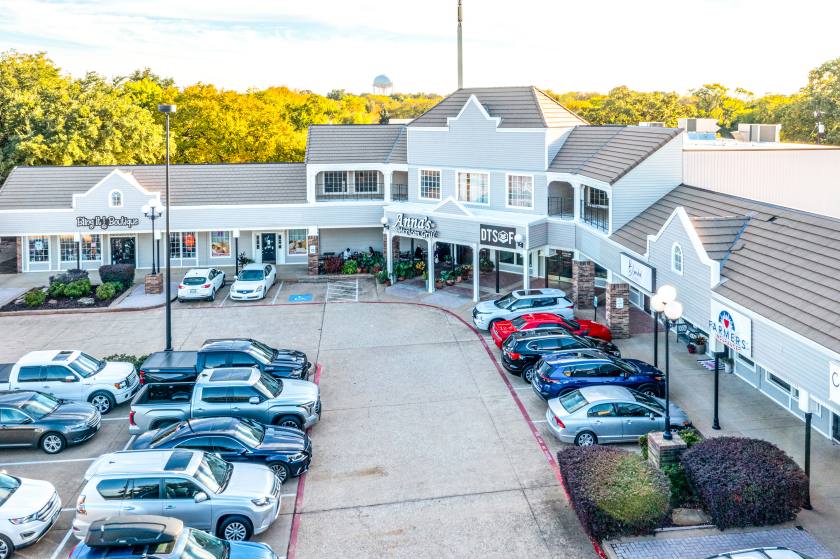
Retail Space
1009 Cheek-Sparger Road Colleyville, TX 76034
1009 Cheek-Sparger Road Colleyville, TX 76034
Details & Description
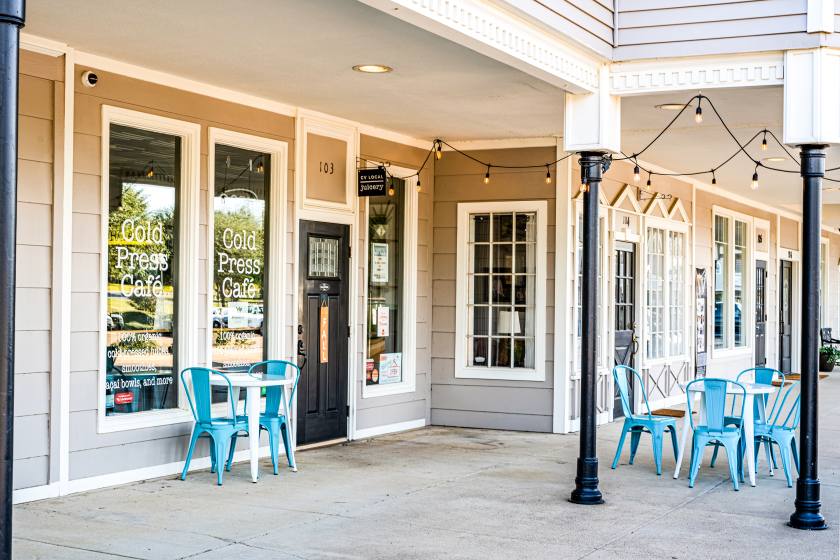
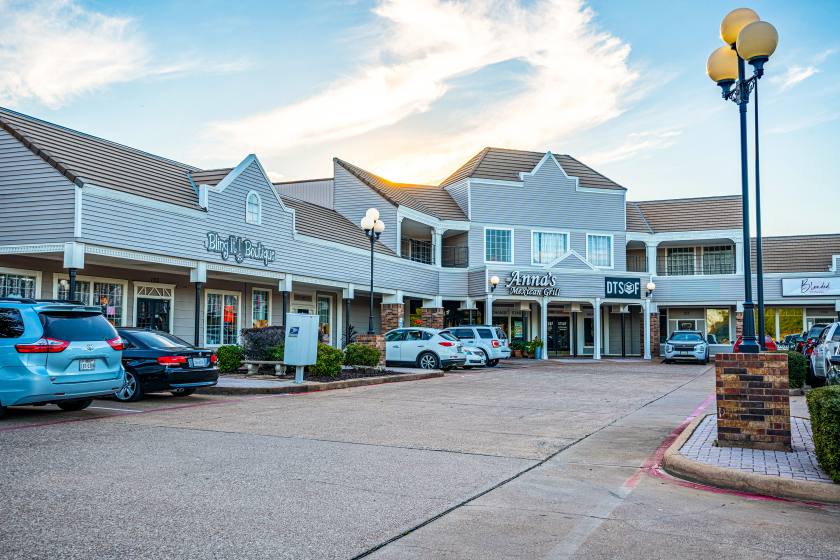
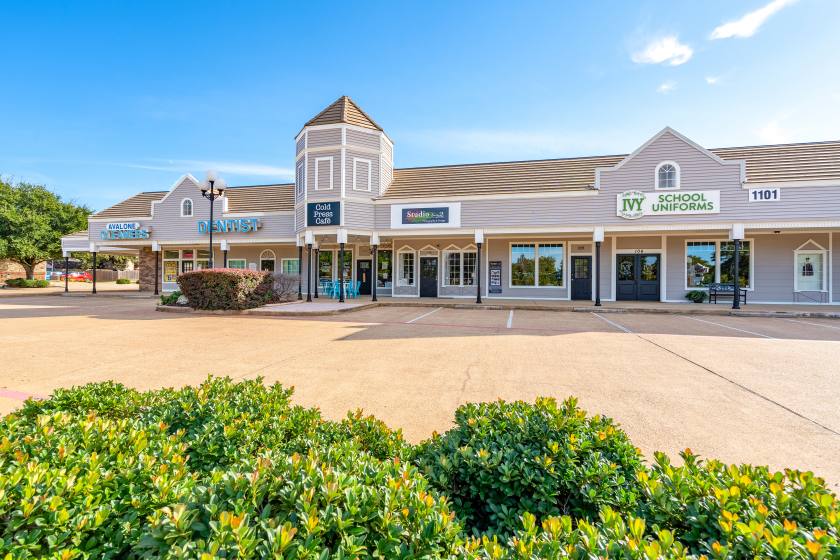
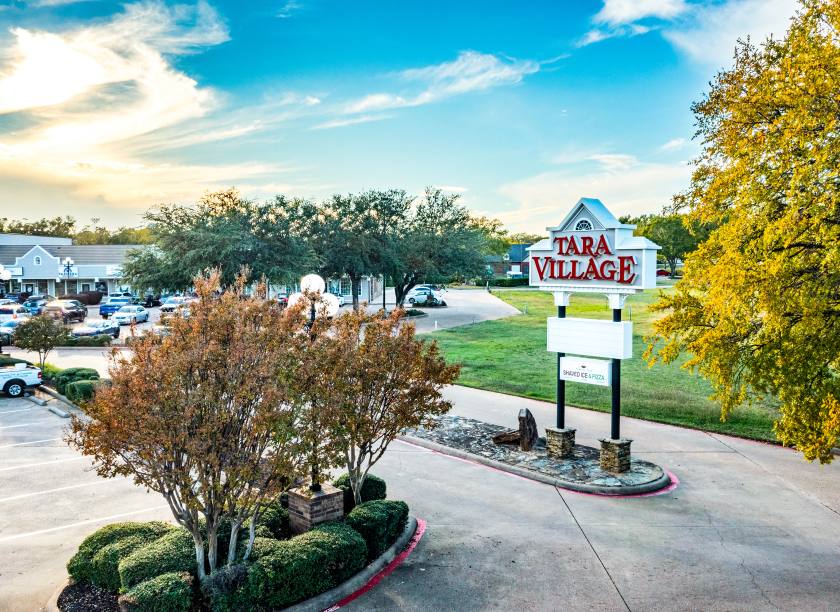
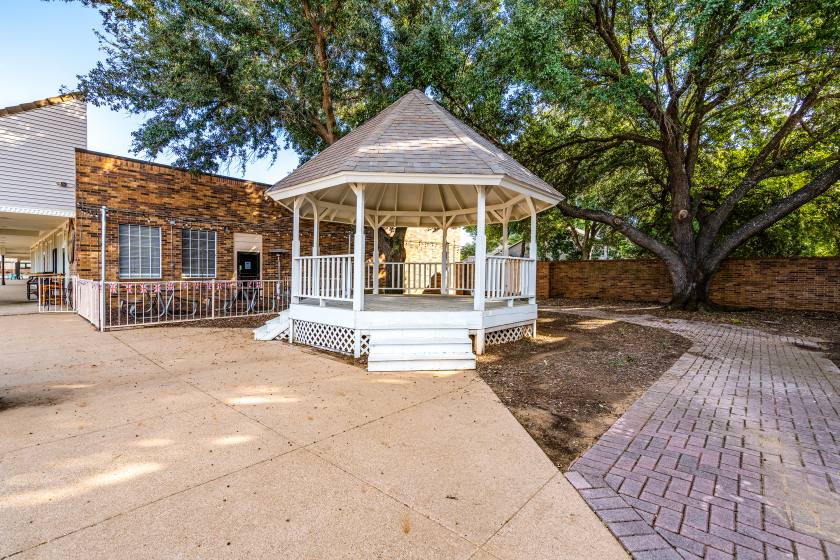
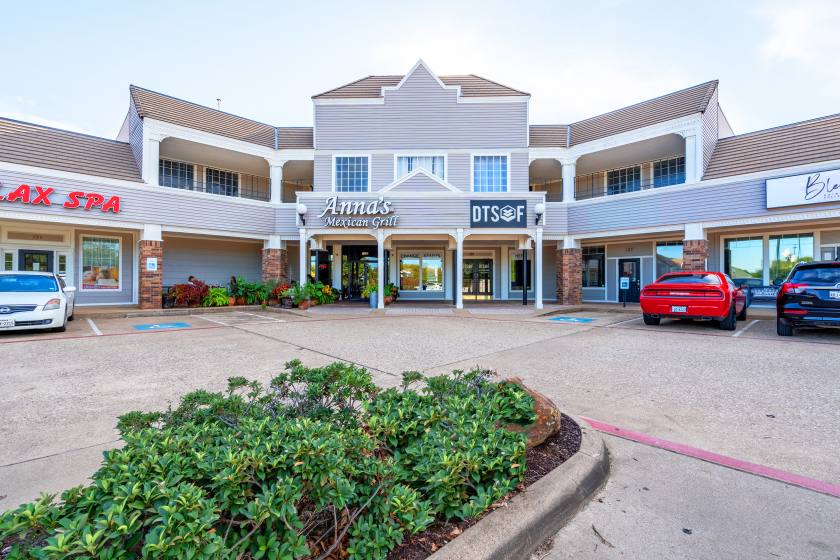
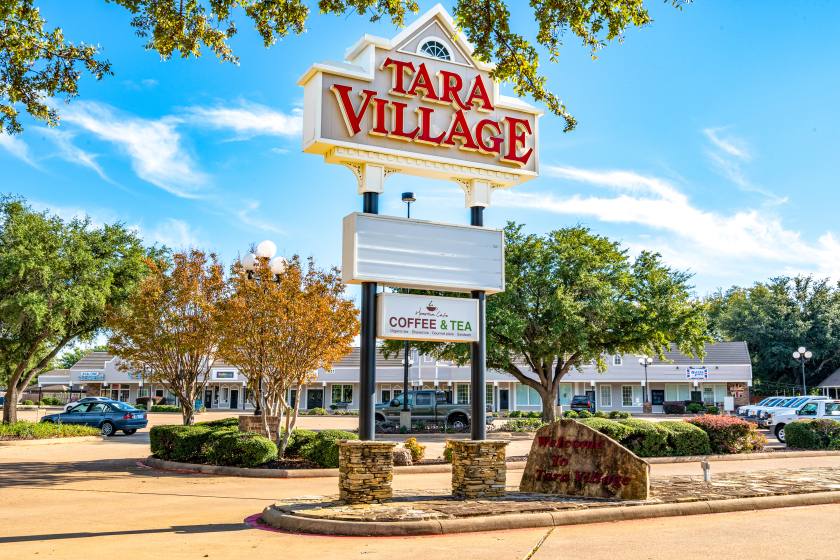
Additional Photos
Listing Agents

Crystal Renyer
O: 214-466-1552
crenyer@structurecommercial.com
O: 214-466-1552
crenyer@structurecommercial.com

Kyle Montana
O: 214-373-8300
M: 214-466-1556
kyle@structurecommercial.com
O: 214-373-8300
M: 214-466-1556
kyle@structurecommercial.com
While we strive to provide the most accurate information, all listing information, and demographic data, is provided by third-parties. As such, MyEListing will not be responsible for the accuracy of the information. It is strongly recommended that you verify all information with the listing agent, and any relevant agencies, prior to making any decisions.