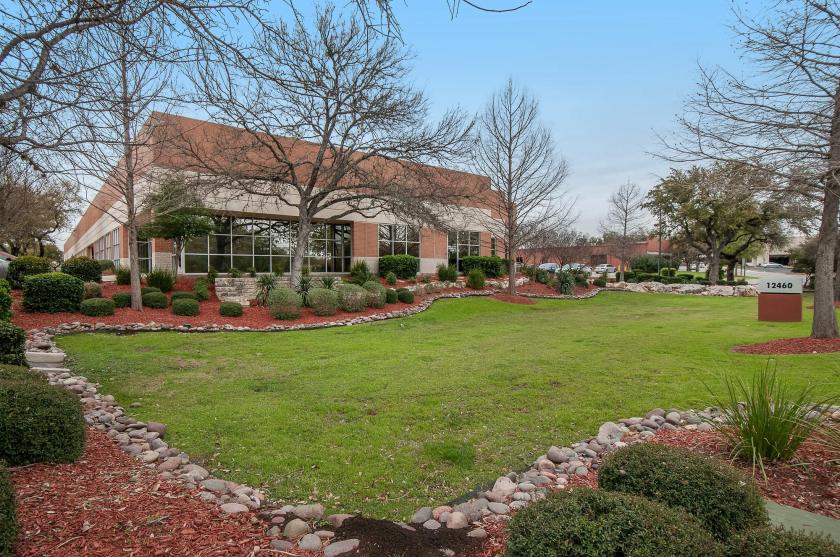
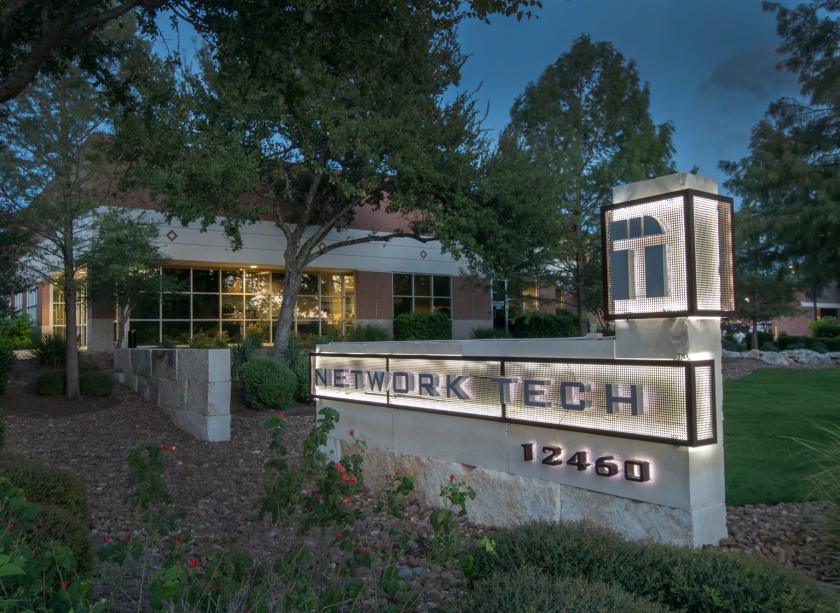
1-Mile | 3-Miles | 5-Miles | ||
---|---|---|---|---|
Total Population | 13,875 | 135,864 | 326,313 | |
Population Median Age | 33 | 35 | 36 | |
Population by Age | 0-9 Yrs | 2302 (16%) | 16871 (12%) | 40633 (12%) |
10-19 Yrs | 1208 (8%) | 15091 (11%) | 40912 (12%) | |
20-29 Yrs | 3565 (25%) | 34360 (25%) | 66583 (20%) | |
30-39 Yrs | 2009 (14%) | 21737 (15%) | 50668 (15%) | |
40-49 Yrs | 1718 (12%) | 14152 (10%) | 38365 (11%) | |
50-59 Yrs | 1127 (8%) | 12203 (8%) | 34584 (10%) | |
60-69 Yrs | 1201 (8%) | 10630 (7%) | 28040 (8%) | |
70+ Yrs | 746 (5%) | 10819 (7%) | 26528 (8%) | |
Median HH Income | $60,741 | $58,129 | $59,976 | |
Total Household Income | < 24K | 1111 (20%) | 10440 (20%) | 23267 (18%) |
25-49K | 1290 (23%) | 12044 (23%) | 27685 (22%) | |
50-74K | 887 (16%) | 9891 (18%) | 22380 (18%) | |
75-99K | 825 (15%) | 6635 (12%) | 15136 (12%) | |
100-199K | 1176 (21%) | 10363 (19%) | 26467 (21%) | |
200K+ | 190 (3%) | 2800 (5%) | 7629 (6%) | |
Highest Education Level | No Diploma | 393 | 6908 | 17661 |
Diploma or GED | 1868 | 14948 | 39215 | |
Some College | 2025 | 19685 | 49727 | |
Assoc. Degree | 772 | 7260 | 18365 | |
Bachelors Degree | 2380 | 23520 | 53410 | |
Higher Degree | 1511 | 15442 | 34549 | |
Total Housing Units | 5,928 | 57,586 | 134,262 | |
--Owner-Occupied | 1,499 | 19,520 | 55,754 | |
--Renter-Occupied | 3,980 | 32,653 | 66,811 | |
Owner-Occupied Values | < 100K | 54 | 1188 | 3357 |
100-199K | 435 | 7058 | 20260 | |
200-299K | 816 | 6781 | 18532 | |
300-399K | 110 | 2685 | 8114 | |
400-499K | 55 | 691 | 2209 | |
500K+ | 29 | 1117 | 3281 | |
Total Working Age Population | 10,808 | 110,969 | 262,717 | |
In Work Force | 7,914 | 77,978 | 182,895 | |
Not In Work Force | 2,894 | 32,990 | 79,822 | |
Workforce Employed | 7,563 | 73,446 | 172,715 | |
Workforce Unemployed | 326 | 4,105 | 8,979 | |
Civlian Workforce | 7,889 | 77,552 | 181,694 | |
Military Workforce | 25 | 426 | 1,202 | |
Total Households | 5,480 | 52,173 | 122,564 | |
Family Households | 2,934 | 26,998 | 69,466 | |
Non-Family Households | 2,545 | 25,175 | 53,099 | |
Married Couple | 1,821 | 18,183 | 48,771 | |
Other Family | 1,113 | 8,815 | 20,694 | |
Married w/Child | 856 | 7,689 | 20,611 | |
Single Male w/Child | 94 | 864 | 2,358 | |
Single Female w/Child | 423 | 3,335 | 7,757 |
Population Change Last Two Decades - Plus Projection
2000 | % | 2010 | % | 2020 | % | 2030 | |
---|---|---|---|---|---|---|---|
Texas | 20,851,820 | +21 | 25,145,561 | +18 | 29,677,668 | +18 | 34,894,452 |
Bexar County | 1,392,931 | +23 | 1,714,773 | +22 | 2,093,502 | +20 | 2,502,617 |
Total Working Age Population:
Total Households:
Total Working Age Population:
Total Households:
Total Working Age Population:
Total Households: