Office Space
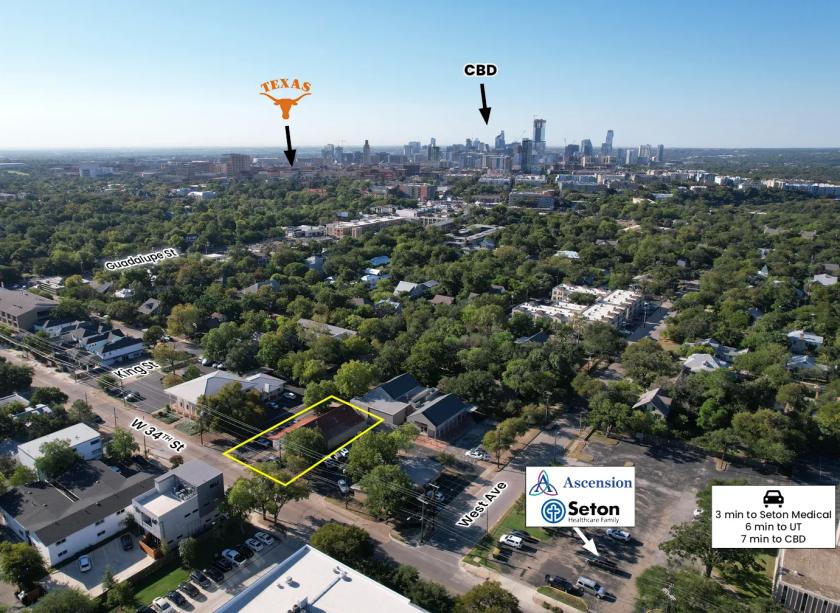
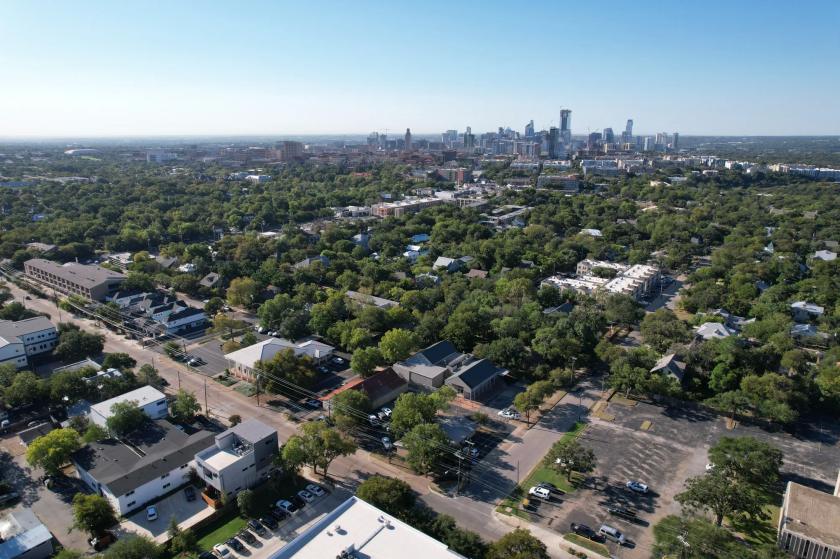
709 West 34th Street Austin, TX 78705
709 West 34th Street Austin, TX 78705
Details & Description
Property Highlights
- • Excellent Visibility and Easy Access
- • Ideal Demographics
- • New HVAC Units
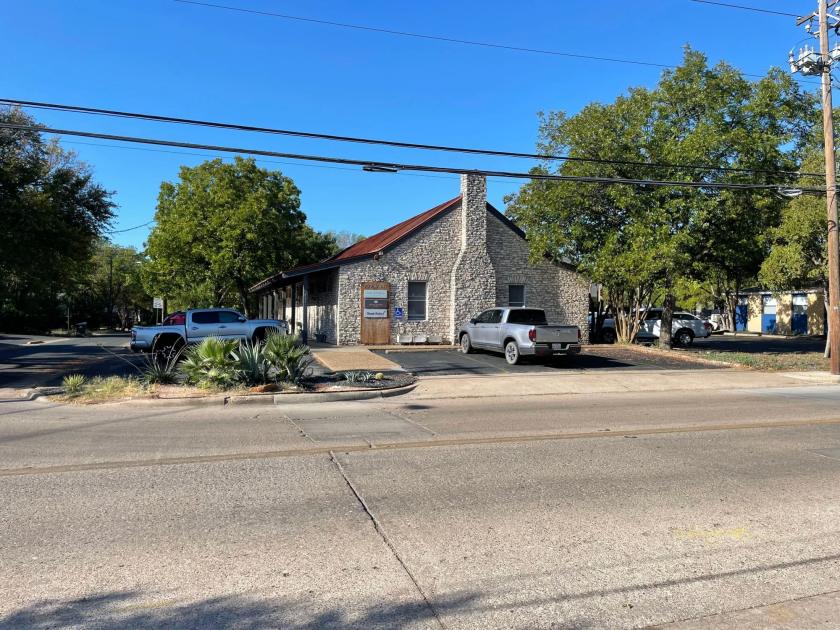
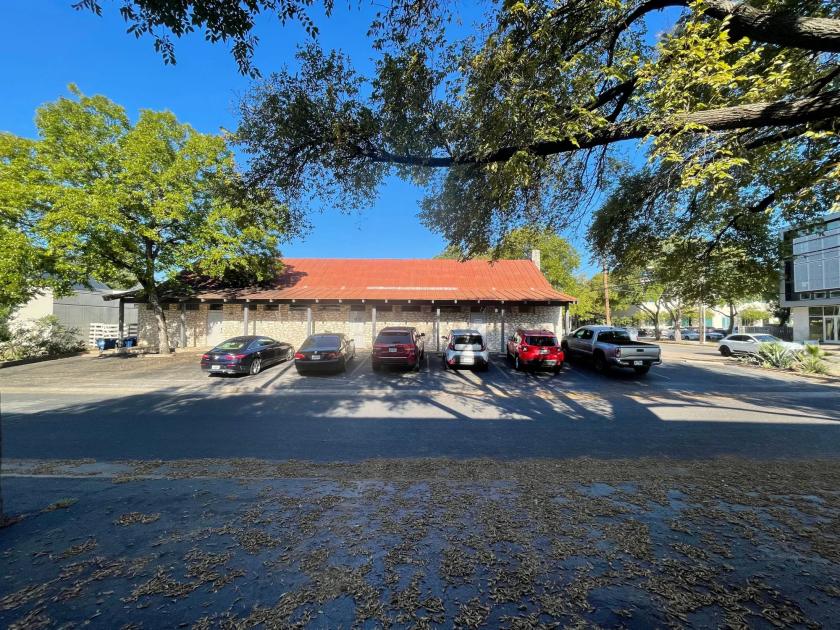
Additional Photos
Listing Agents

Michael Smith
O: 512-391-0718
M: 817-995-5639
msmith@stcroixca.com
O: 512-391-0718
M: 817-995-5639
msmith@stcroixca.com

Michael McKinley
O: 512-391-0718
M: 512-773-6170
mmckinley@stcroixca.com
O: 512-391-0718
M: 512-773-6170
mmckinley@stcroixca.com
While we strive to provide the most accurate information, all listing information, and demographic data, is provided by third-parties. As such, MyEListing will not be responsible for the accuracy of the information. It is strongly recommended that you verify all information with the listing agent, and any relevant agencies, prior to making any decisions.


