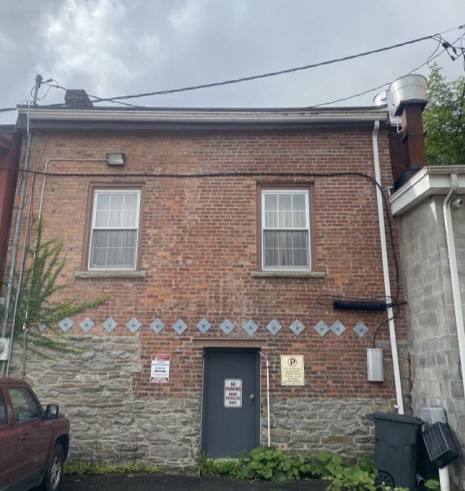
Retail Space
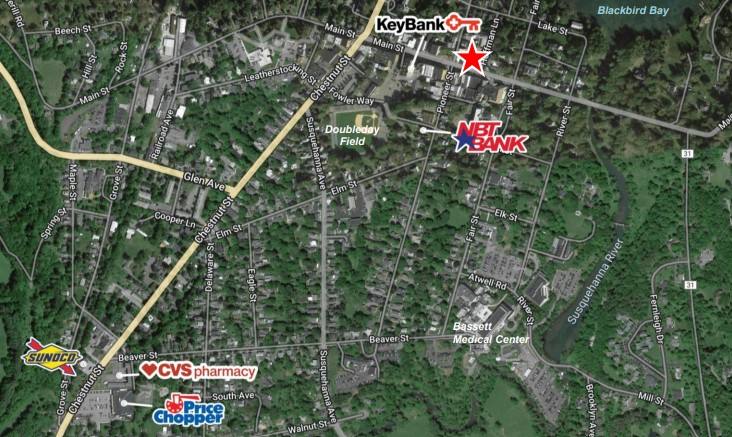
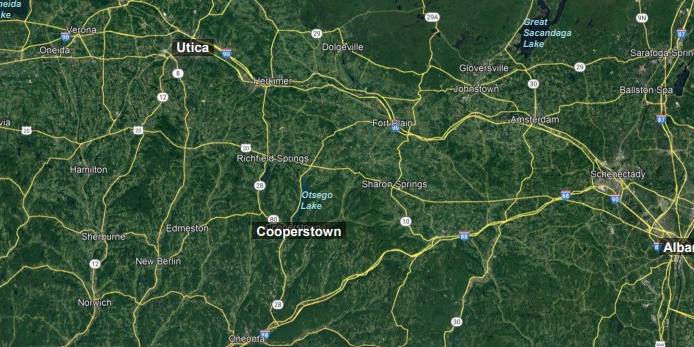
62 Main Street Cooperstown, NY 13326
62 Main Street Cooperstown, NY 13326

Details & Description
Property Highlights
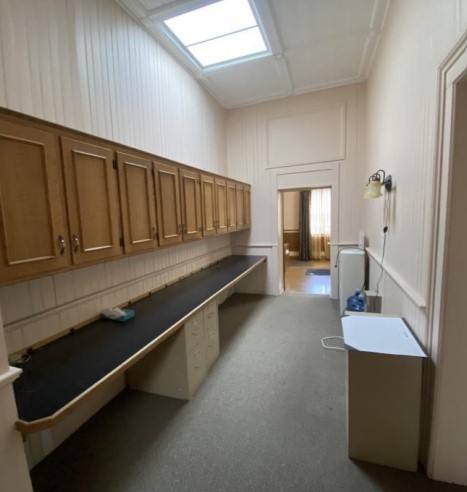
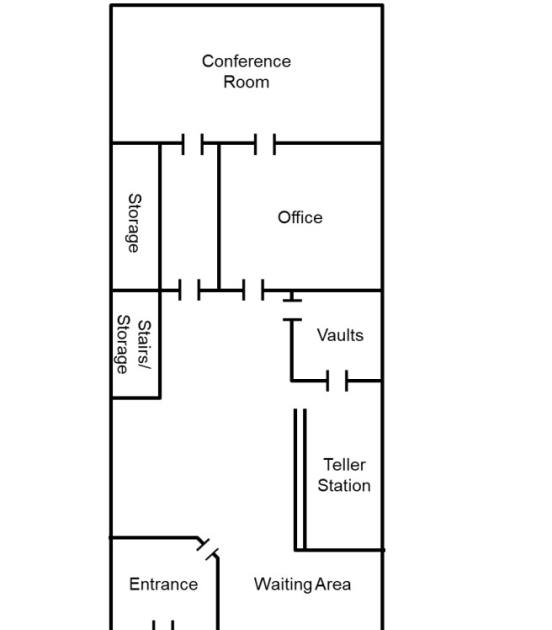
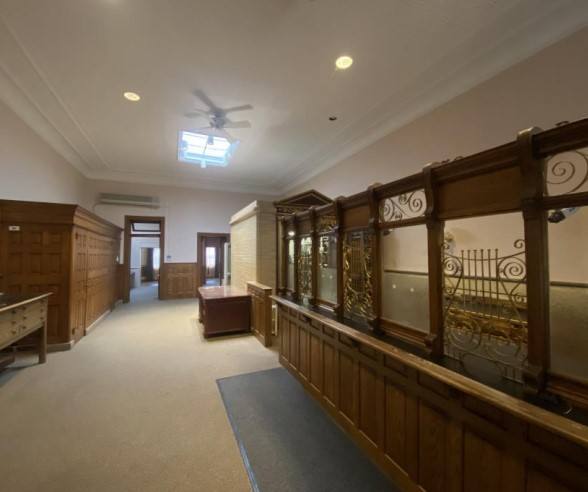
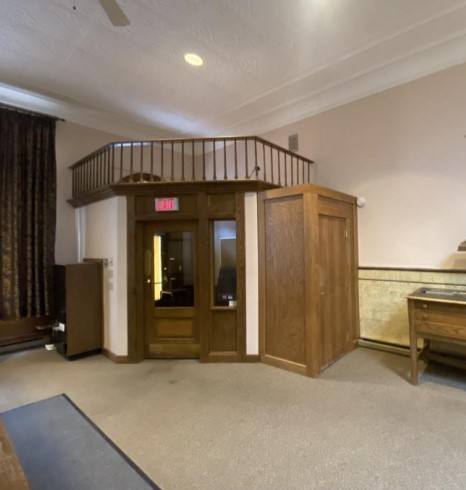
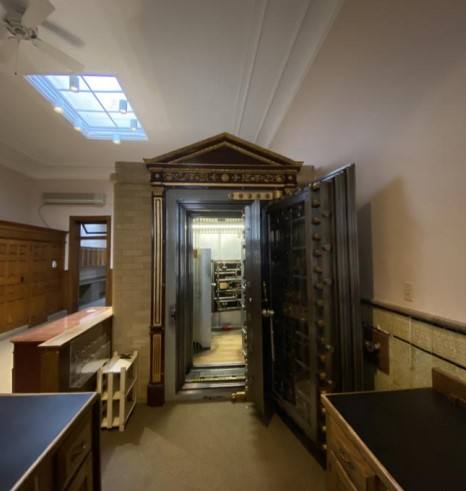
• Ground level space with a teller station, vaults, management office, large conference room, and more
• Large front window and skylights throughout the space allow for plenty of natural light
Additional Photos

Listing Agents

Kathryn Saraceno
O: 315-736-0856
M: 315-335-7710
ksaraceno@pyramidbrokerage.com
O: 315-736-0856
M: 315-335-7710
ksaraceno@pyramidbrokerage.com

Joyce M. MacKnight
O: 315-445-8514
M: 315-727-5002
jmacknight@pyramidbrokerage.com
O: 315-445-8514
M: 315-727-5002
jmacknight@pyramidbrokerage.com

James Dylan Furney
O: 315-225-8571
M: 315-225-8571
jfurney@pyramidbrokerage.com
O: 315-225-8571
M: 315-225-8571
jfurney@pyramidbrokerage.com
While we strive to provide the most accurate information, all listing information, and demographic data, is provided by third-parties. As such, MyEListing will not be responsible for the accuracy of the information. It is strongly recommended that you verify all information with the listing agent, and any relevant agencies, prior to making any decisions.