Commercial Land
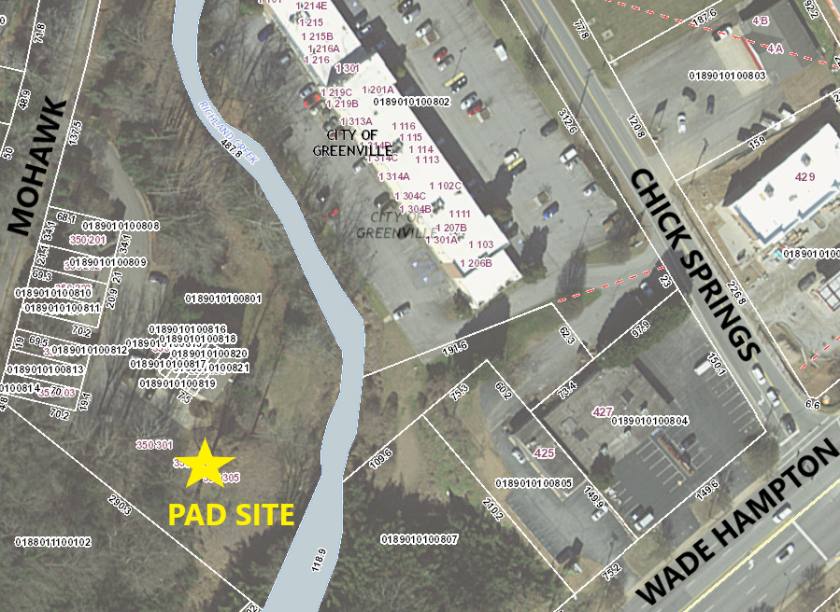
350 Mohawk Drive Greenville, SC 29609
350 Mohawk Drive Greenville, SC 29609
Details & Description
Property Highlights
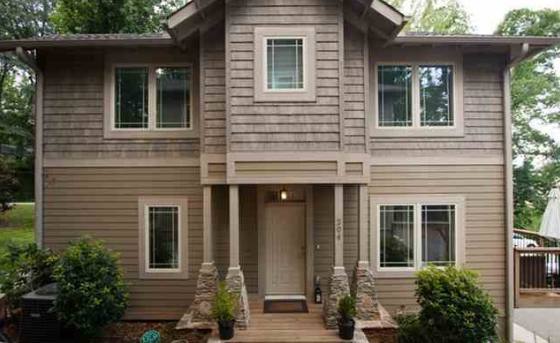
- • Building pad for 5 condo units
- • North Main, Greenville
- • Architectural plans available
Listing Agents

Joseph Fuduric
O: 864-346-7643
joseph@watershedgvl.com
O: 864-346-7643
joseph@watershedgvl.com
While we strive to provide the most accurate information, all listing information, and demographic data, is provided by third-parties. As such, MyEListing will not be responsible for the accuracy of the information. It is strongly recommended that you verify all information with the listing agent, and any relevant agencies, prior to making any decisions.