Specialty Real Estate
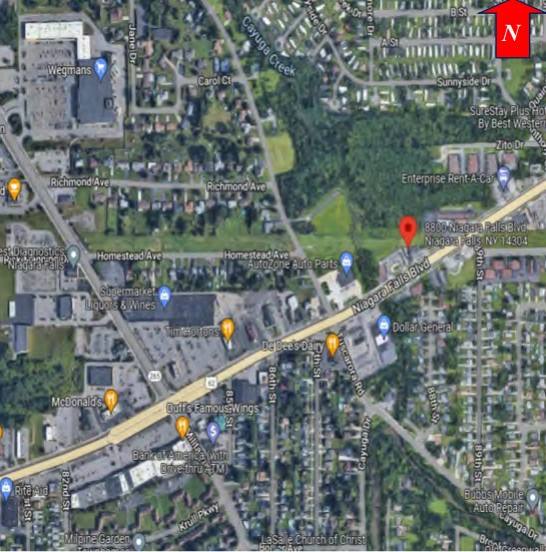
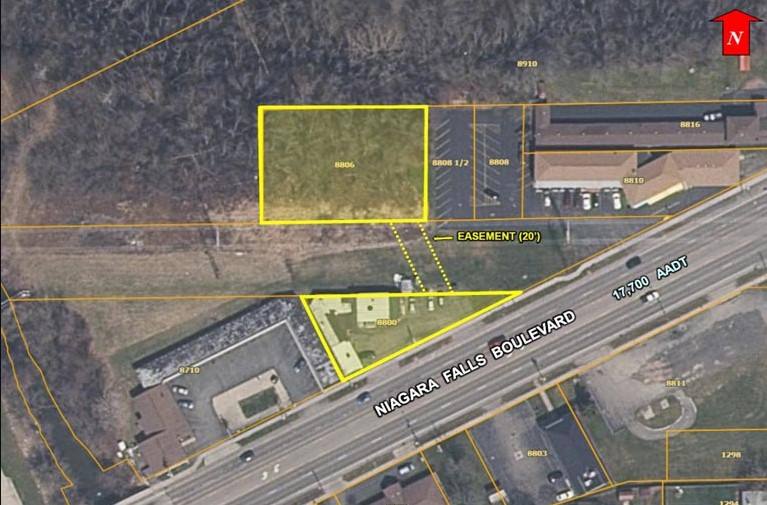
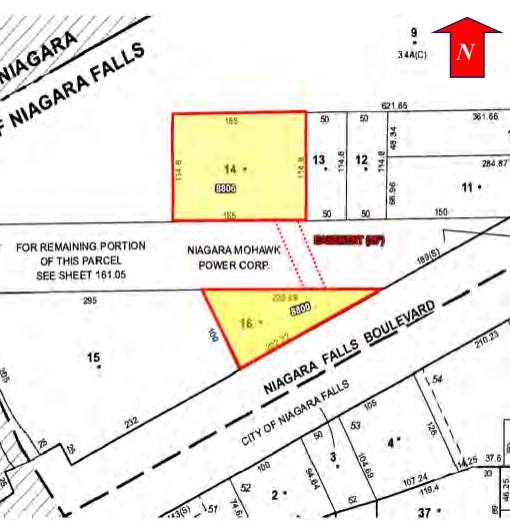
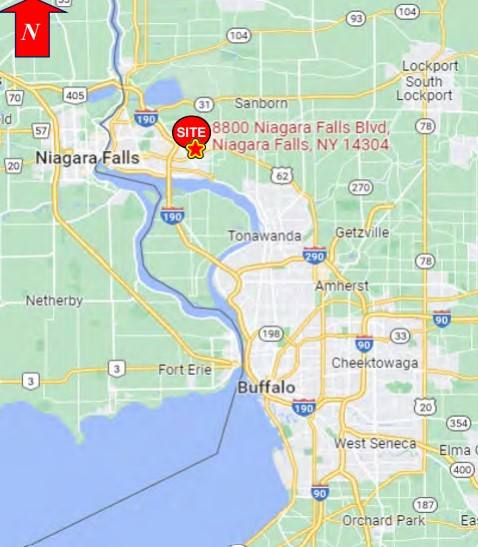
8800 Niagara Falls Boulevard Niagara Falls, NY 14304
8800 Niagara Falls Boulevard Niagara Falls, NY 14304

Details & Description
Property Highlights
• Nearby amenities include restaurants and a wide variety of retail and commercial services
• Ideal for expanded used car sales or other commercial redevelopment
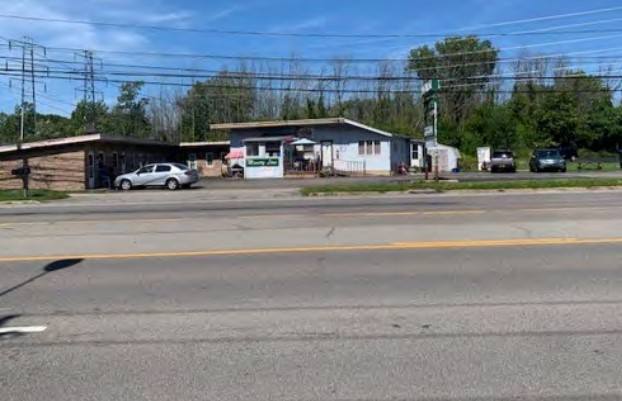
Additional Photos
Listing Agents

Benedict J. Borruso
O: 716-852-7500
M: 716-861-5090
bborruso@pyramidbrokerage.com
O: 716-852-7500
M: 716-861-5090
bborruso@pyramidbrokerage.com
While we strive to provide the most accurate information, all listing information, and demographic data, is provided by third-parties. As such, MyEListing will not be responsible for the accuracy of the information. It is strongly recommended that you verify all information with the listing agent, and any relevant agencies, prior to making any decisions.