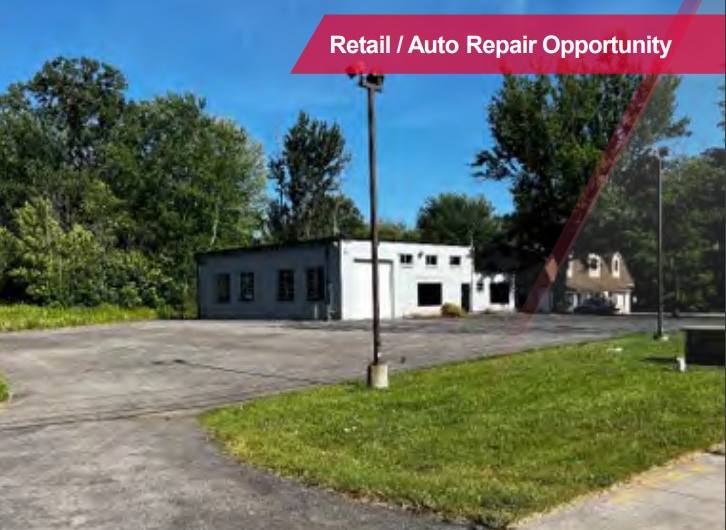
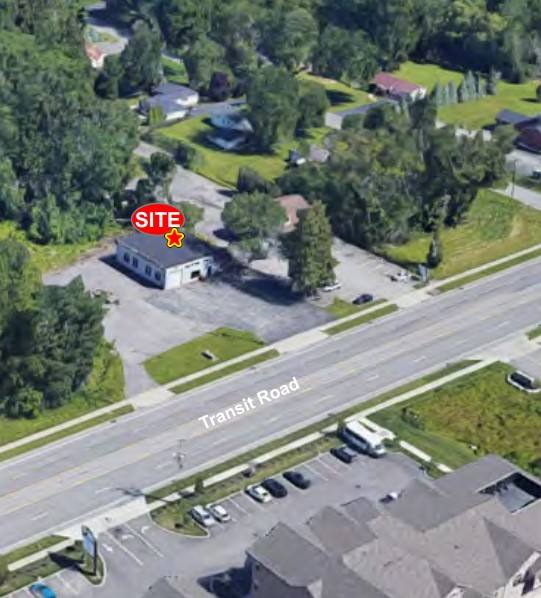
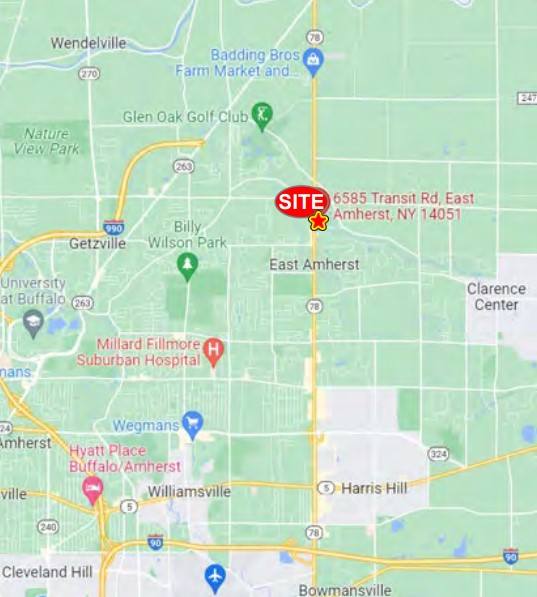
1-Mile | 3-Miles | 5-Miles | ||
---|---|---|---|---|
Total Population | 5,754 | 39,297 | 94,545 | |
Population Median Age | 40 | 43 | 42 | |
Population by Age | 0-9 Yrs | 795 (13%) | 4530 (11%) | 10438 (11%) |
10-19 Yrs | 886 (15%) | 5345 (13%) | 13337 (14%) | |
20-29 Yrs | 289 (5%) | 2676 (6%) | 9260 (9%) | |
30-39 Yrs | 557 (9%) | 3681 (9%) | 9303 (9%) | |
40-49 Yrs | 926 (16%) | 4773 (12%) | 10916 (11%) | |
50-59 Yrs | 941 (16%) | 6695 (17%) | 14539 (15%) | |
60-69 Yrs | 735 (12%) | 5291 (13%) | 11882 (12%) | |
70+ Yrs | 625 (10%) | 6306 (16%) | 14870 (15%) | |
Median HH Income | $129,462 | $112,033 | $99,971 | |
Total Household Income | < 24K | 208 (9%) | 1746 (11%) | 4791 (12%) |
25-49K | 290 (12%) | 2005 (12%) | 4740 (12%) | |
50-74K | 146 (6%) | 1667 (10%) | 4675 (12%) | |
75-99K | 184 (8%) | 1696 (10%) | 4373 (11%) | |
100-199K | 856 (38%) | 5283 (33%) | 12197 (32%) | |
200K+ | 564 (25%) | 3385 (21%) | 6373 (17%) | |
Highest Education Level | No Diploma | 120 | 1018 | 2409 |
Diploma or GED | 424 | 3850 | 9963 | |
Some College | 552 | 3617 | 9079 | |
Assoc. Degree | 355 | 2475 | 6393 | |
Bachelors Degree | 1153 | 7563 | 18512 | |
Higher Degree | 1299 | 9422 | 19132 | |
Total Housing Units | 2,394 | 16,584 | 39,570 | |
--Owner-Occupied | 1,776 | 12,935 | 29,319 | |
--Renter-Occupied | 473 | 2,846 | 7,829 | |
Owner-Occupied Values | < 100K | 9 | 365 | 1157 |
100-199K | 199 | 1980 | 6221 | |
200-299K | 450 | 3758 | 10170 | |
300-399K | 520 | 3594 | 5836 | |
400-499K | 371 | 1884 | 2741 | |
500K+ | 228 | 1354 | 3194 | |
Total Working Age Population | 4,265 | 31,392 | 76,955 | |
In Work Force | 2,787 | 19,585 | 47,565 | |
Not In Work Force | 1,478 | 11,807 | 29,390 | |
Workforce Employed | 2,708 | 19,038 | 46,079 | |
Workforce Unemployed | 79 | 534 | 1,428 | |
Civlian Workforce | 2,787 | 19,572 | 47,507 | |
Military Workforce | 0 | 13 | 58 | |
Total Households | 2,248 | 15,782 | 37,149 | |
Family Households | 1,606 | 11,053 | 24,882 | |
Non-Family Households | 642 | 4,729 | 12,267 | |
Married Couple | 1,440 | 9,543 | 21,294 | |
Other Family | 167 | 1,510 | 3,588 | |
Married w/Child | 774 | 3,989 | 8,849 | |
Single Male w/Child | 20 | 114 | 444 | |
Single Female w/Child | 26 | 587 | 1,148 |
Population Change Last Two Decades - Plus Projection
2000 | % | 2010 | % | 2020 | % | 2030 | |
---|---|---|---|---|---|---|---|
New York | 18,976,457 | +2 | 19,378,102 | +4 | 20,146,131 | +2 | 20,604,030 |
Erie County | 950,265 | -3 | 919,040 | +2 | 936,084 | +1 | 949,073 |
Niagara County | 219,846 | -2 | 216,469 | -3 | 209,940 | -3 | 202,950 |
Total Working Age Population:
Total Households:
Total Working Age Population:
Total Households:
Total Working Age Population:
Total Households: