Commercial Land
4600 County Road 172 Alvin, TX 77511
4600 County Road 172 Alvin, TX 77511
Details & Description
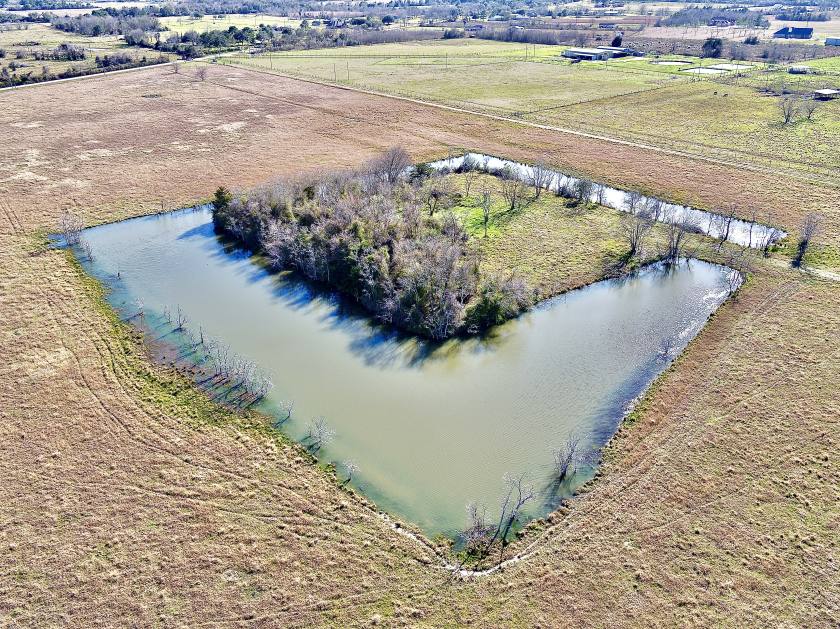
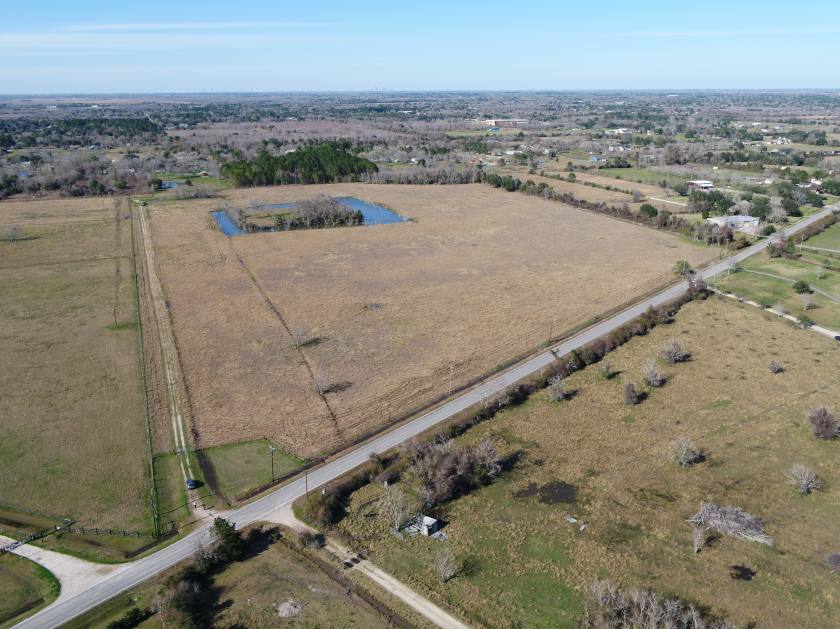
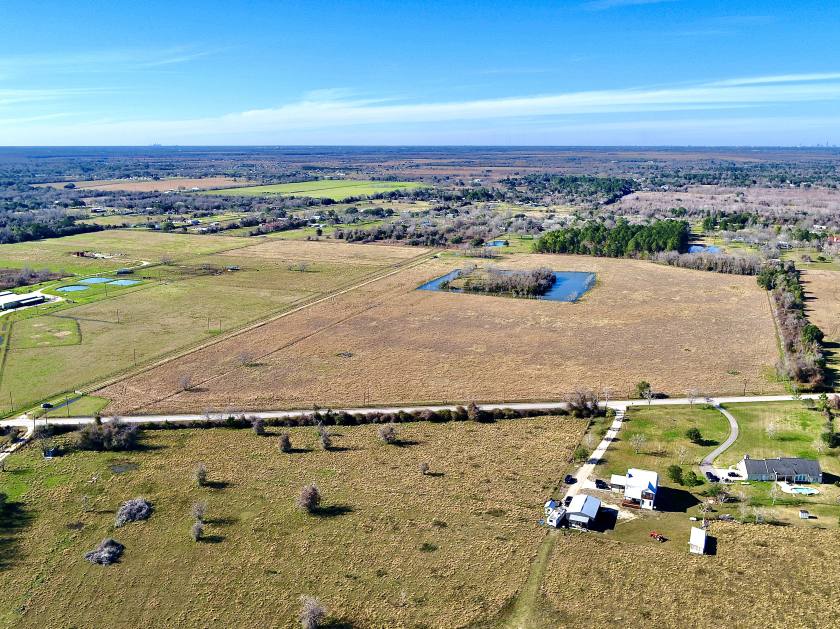
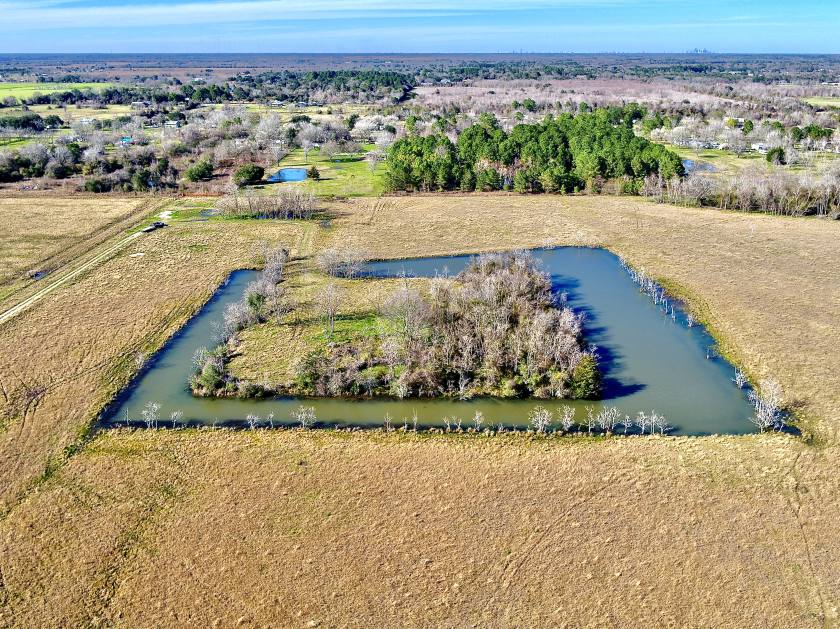
Property Highlights
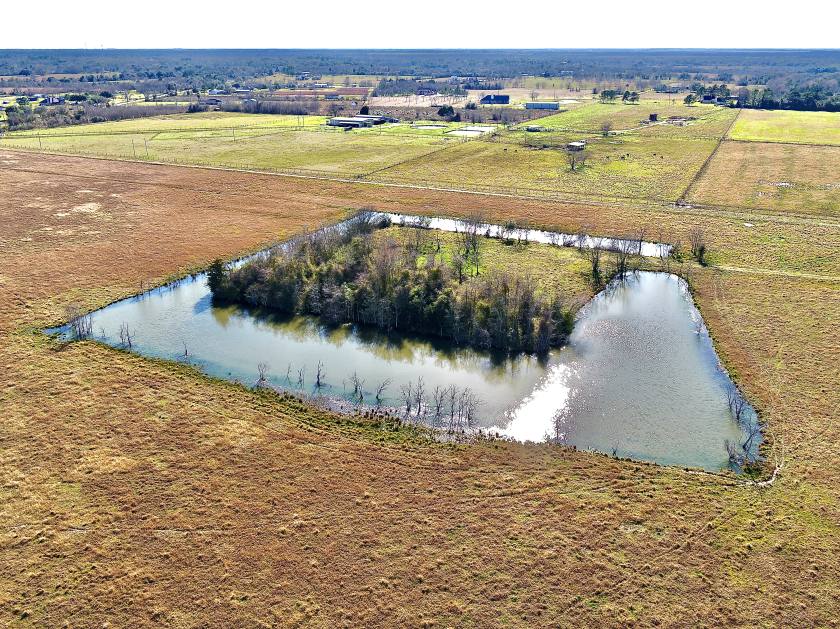
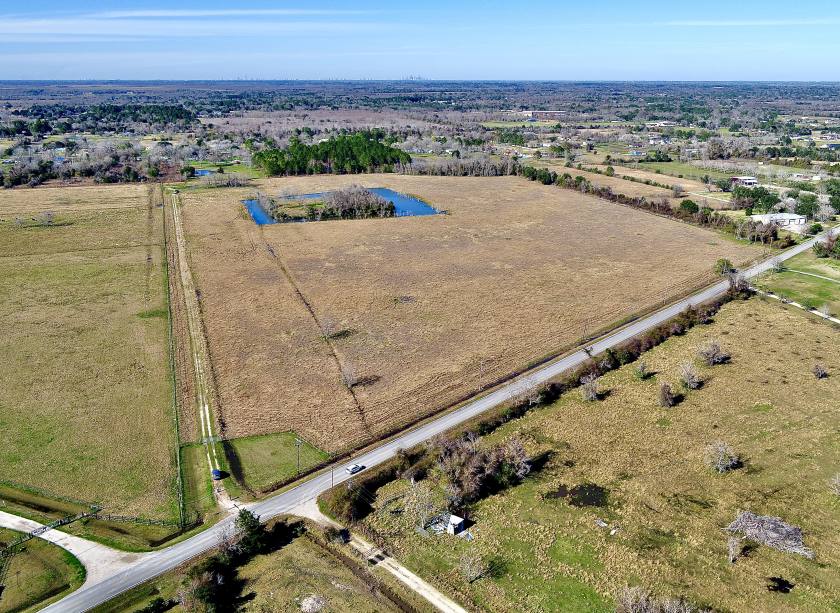
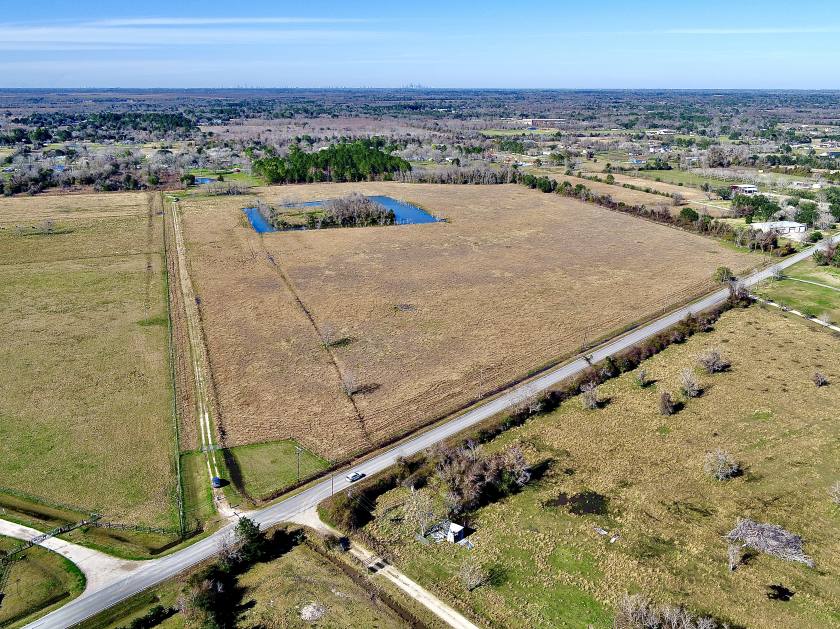
- • Approximately 1,300 feet of frontage along CR-172
- • Unrestricted property with endless possibilities
- • Build your dream home
- • Subdivide into Country Acreage lots
- • Buy & Hold
- • No Floodplain
Additional Photos


Listing Agents

Jacob Burks
O: 281-455-9502
jburks.bhcre@outlook.com
O: 281-455-9502
jburks.bhcre@outlook.com
While we strive to provide the most accurate information, all listing information, and demographic data, is provided by third-parties. As such, MyEListing will not be responsible for the accuracy of the information. It is strongly recommended that you verify all information with the listing agent, and any relevant agencies, prior to making any decisions.