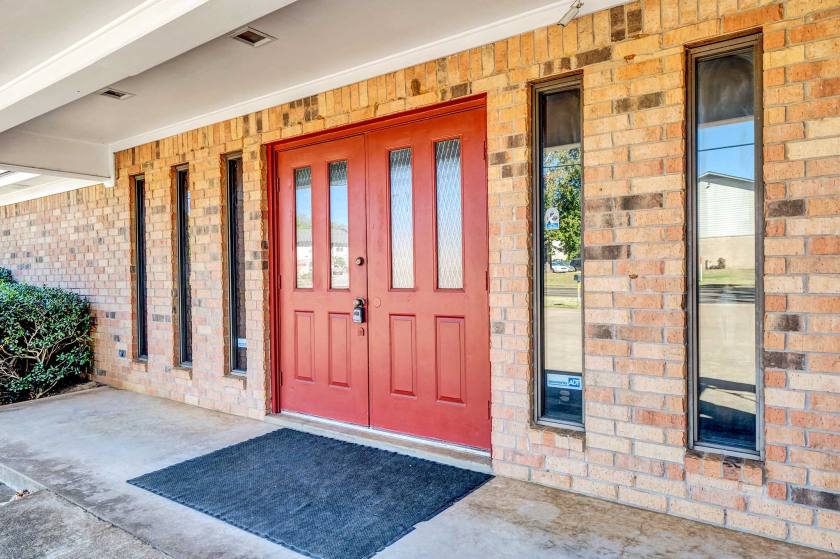
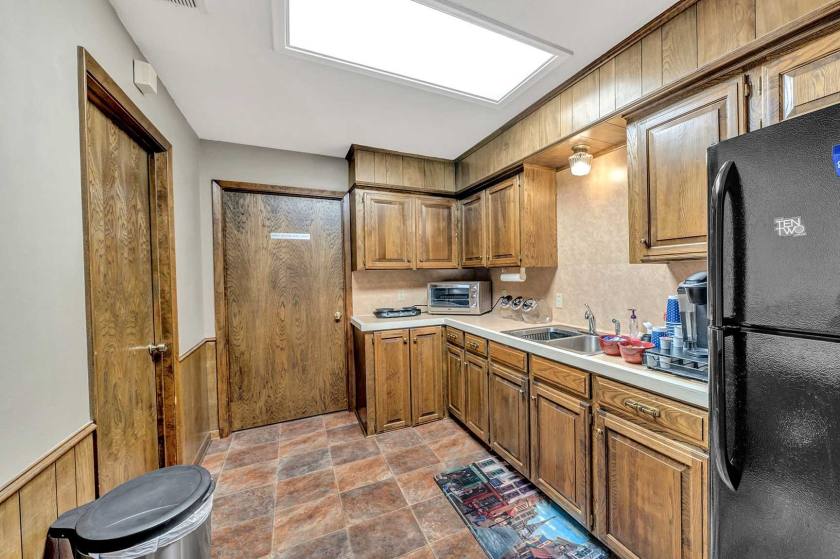
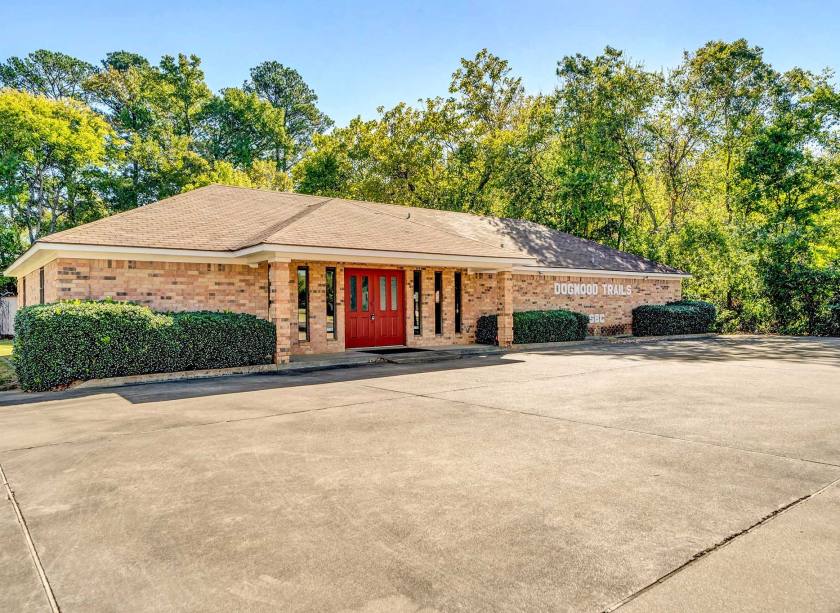
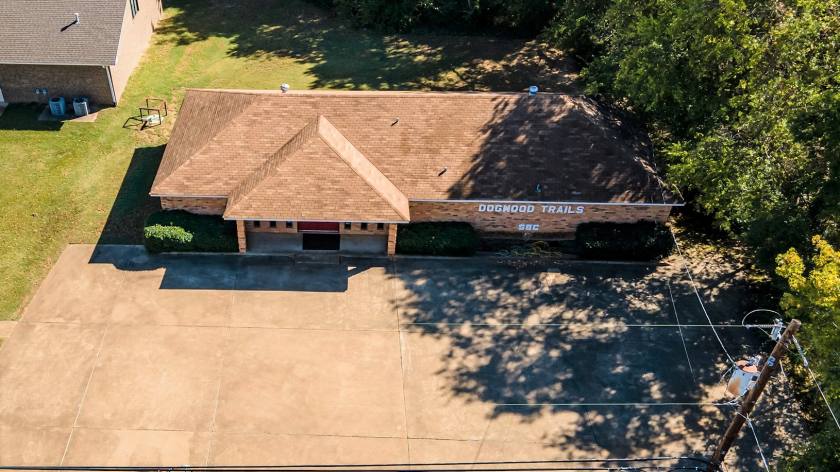
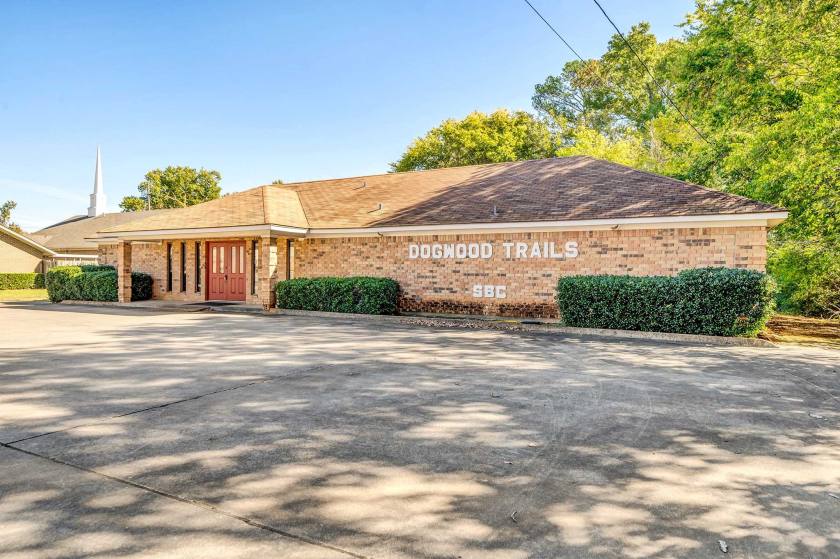
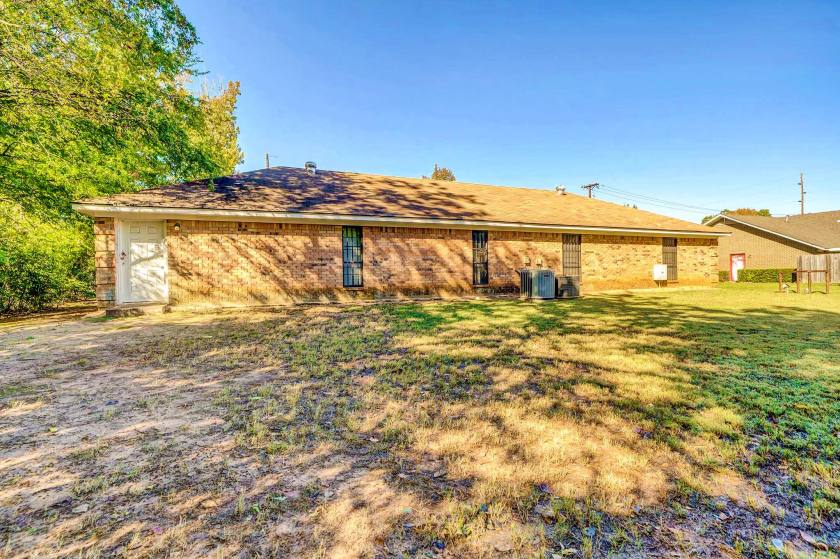
Office Space
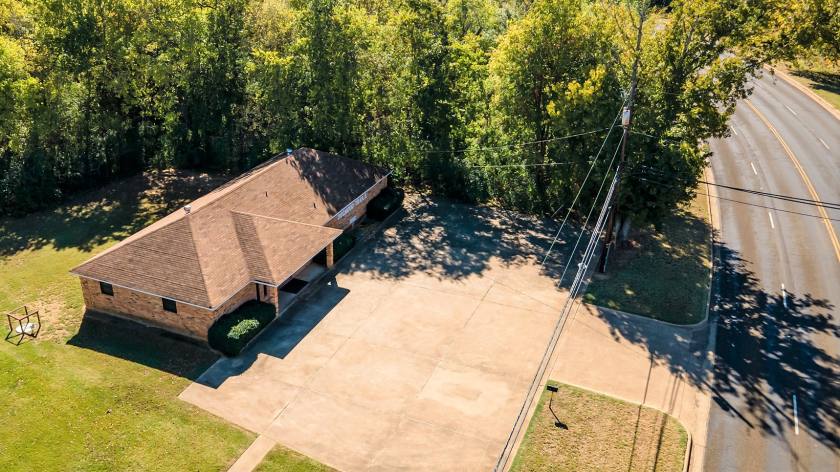
1502 South Bolton Street Jacksonville, TX 75766
1502 South Bolton Street Jacksonville, TX 75766
Details & Description
Property Highlights
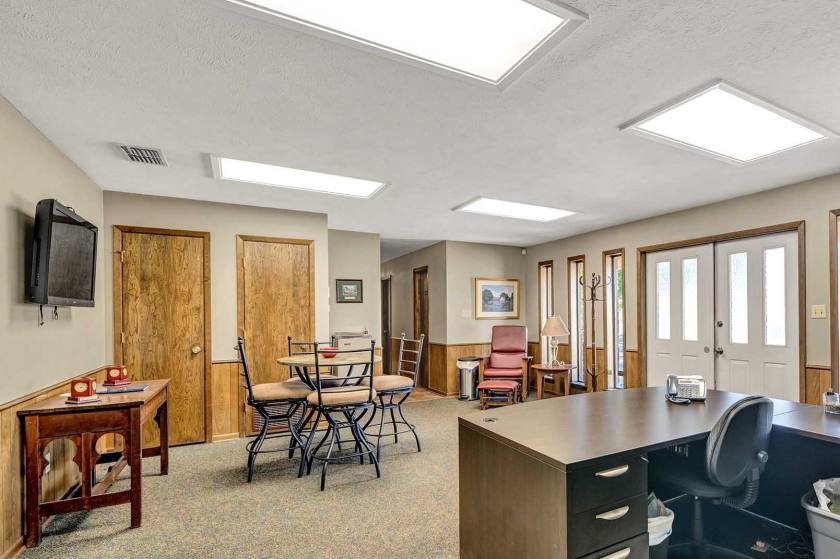
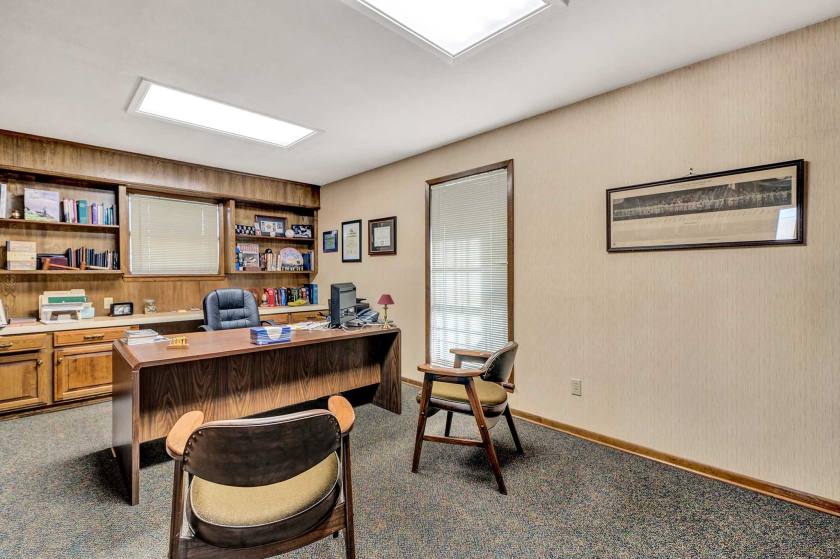
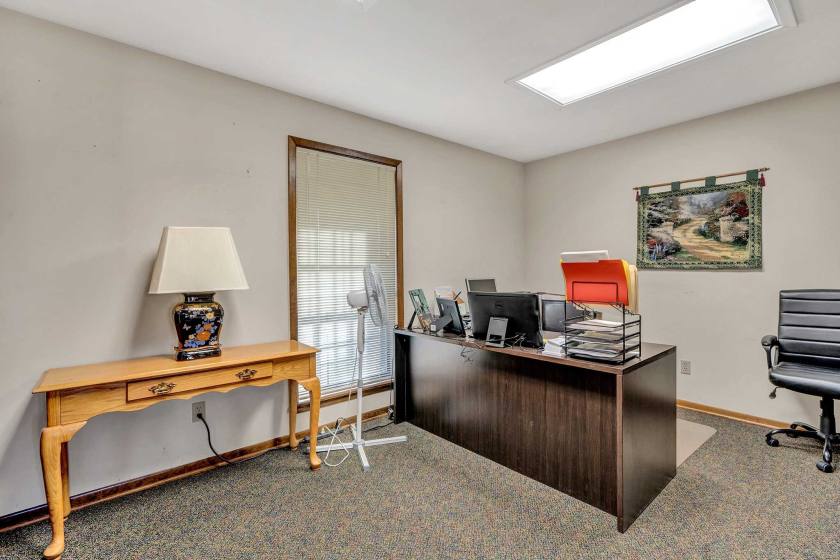
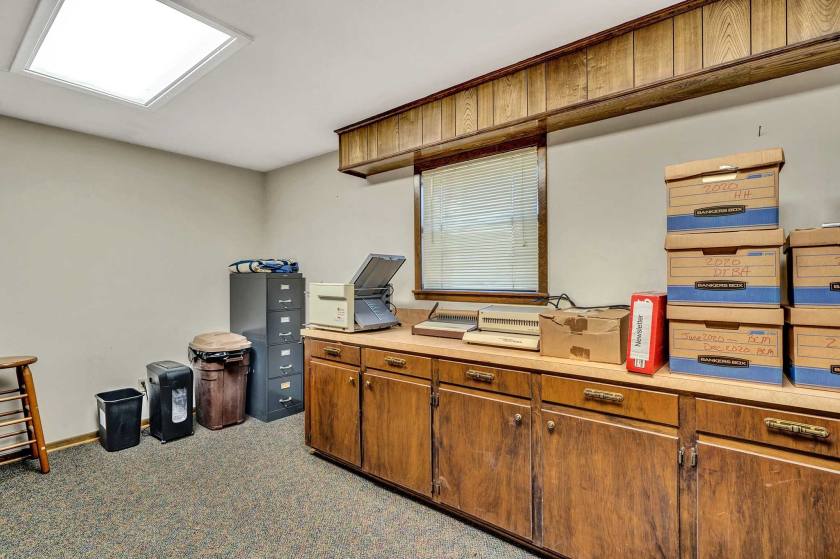
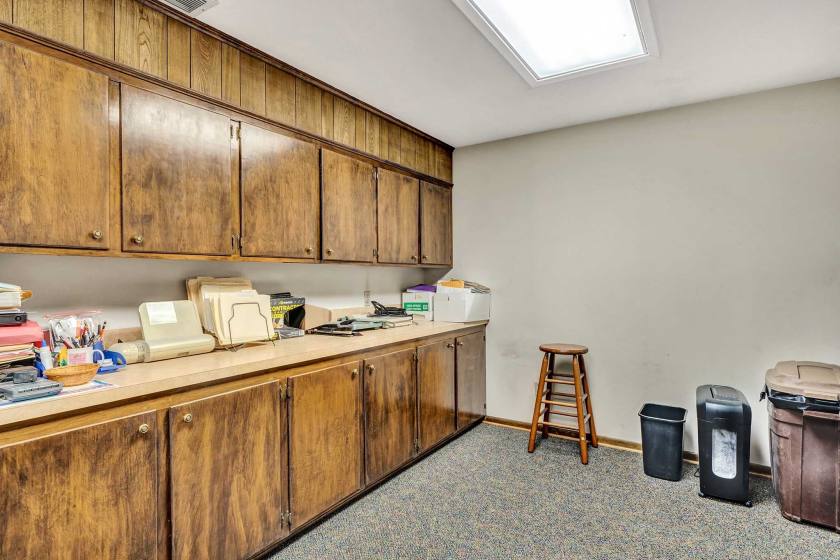
- • 3 plus offices
- • Large conference room
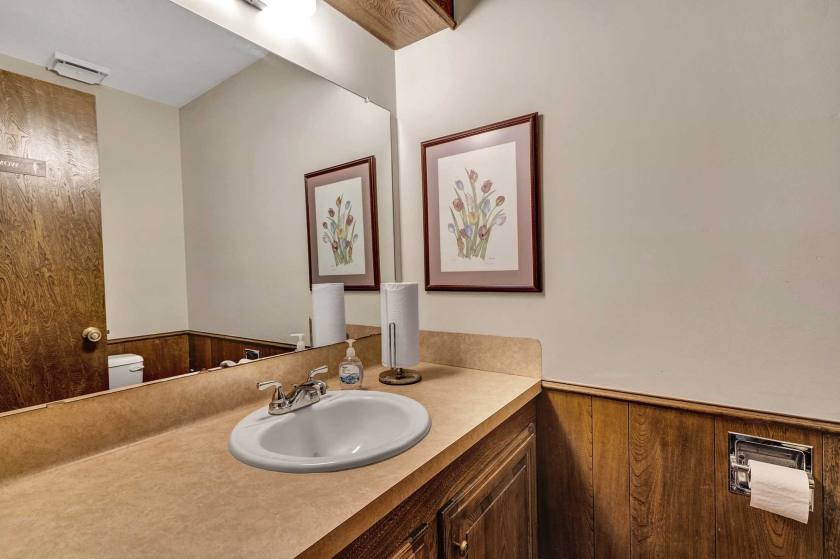
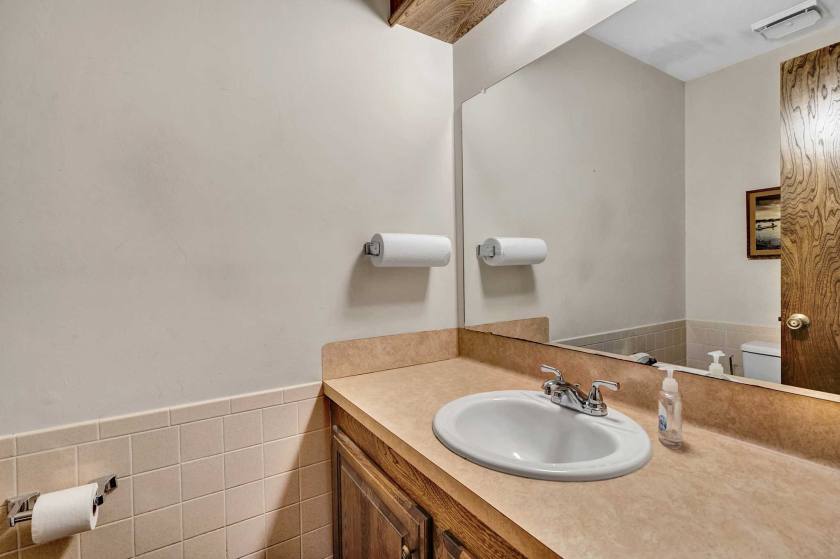
- • 2 bathrooms
- • 4800 sf of parking
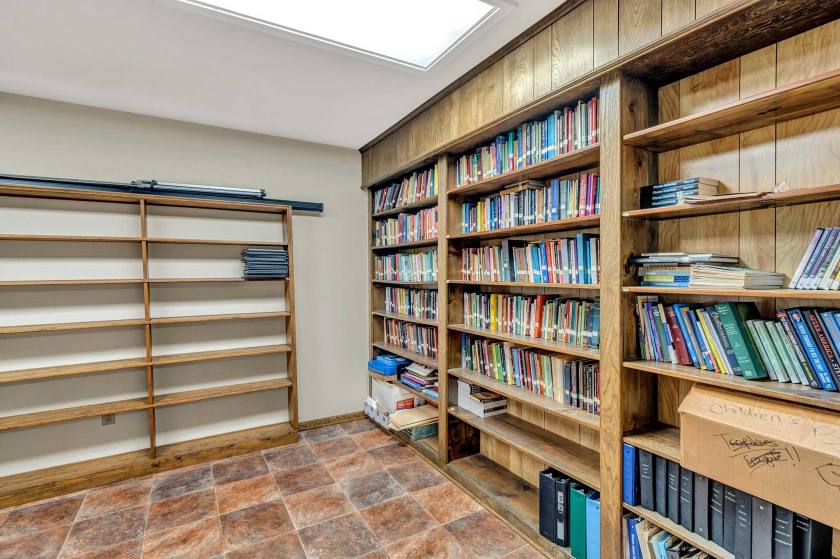
Additional Photos
Listing Agents

Susan Brock
O: 903-571-6772
sbrock@mossyoakproperties.com
O: 903-571-6772
sbrock@mossyoakproperties.com
While we strive to provide the most accurate information, all listing information, and demographic data, is provided by third-parties. As such, MyEListing will not be responsible for the accuracy of the information. It is strongly recommended that you verify all information with the listing agent, and any relevant agencies, prior to making any decisions.