Industrial Properties
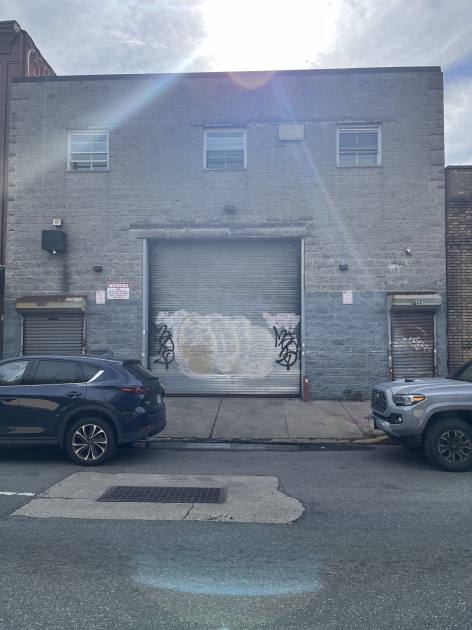
1632 Atlantic Avenue Brooklyn, NY 11213
1632 Atlantic Avenue Brooklyn, NY 11213

Details & Description
Property Highlights
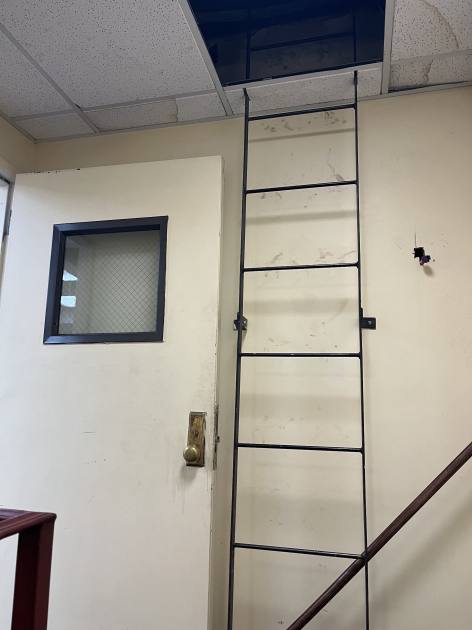
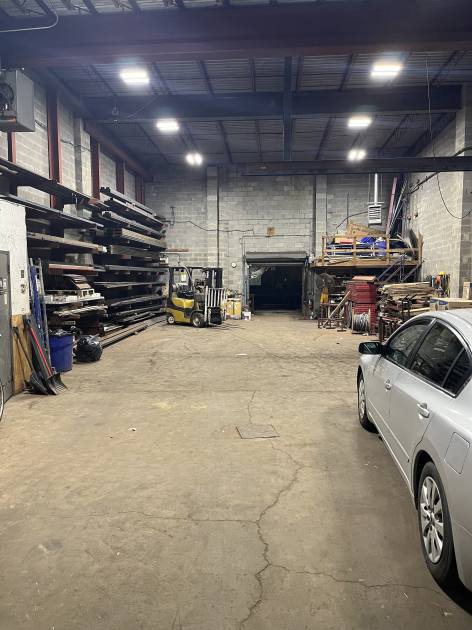
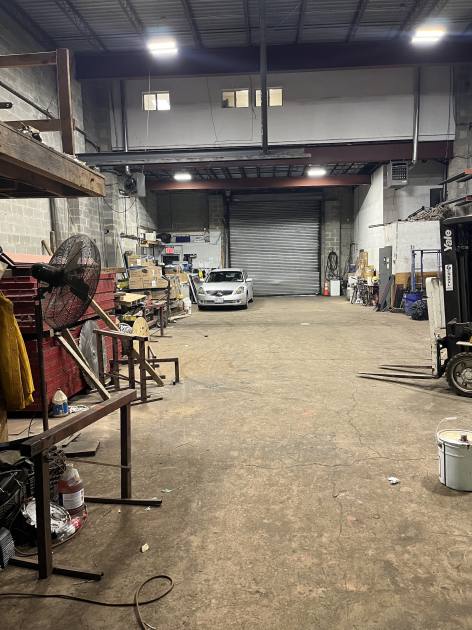
- • Extra high ceiling height
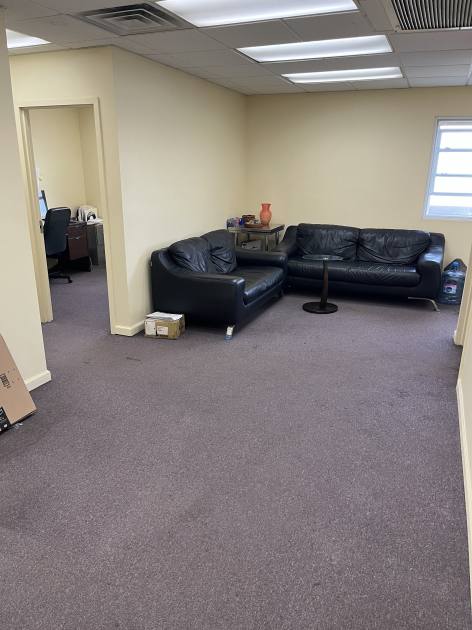
- • Delivered vacant
- • 16-25 ft ceiling height
- • Roll down gate is 16 ft wide
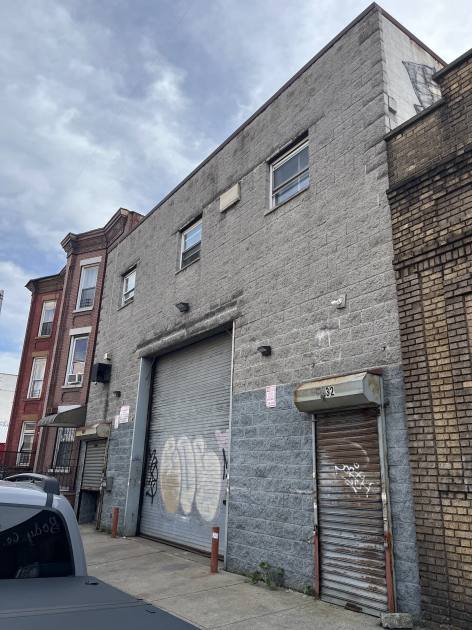
- • Building is 40 ft wide
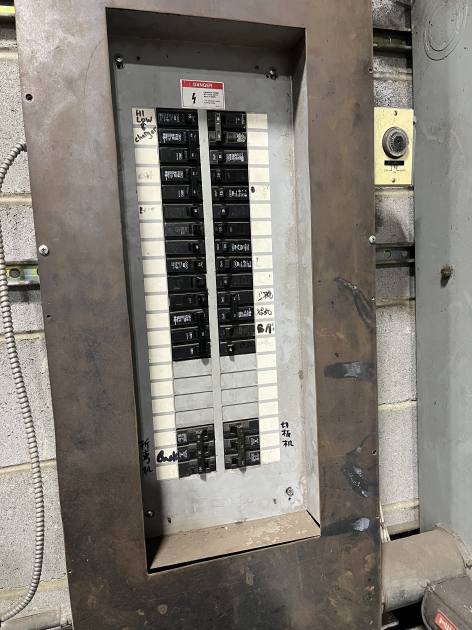
- • Building has 400 amps
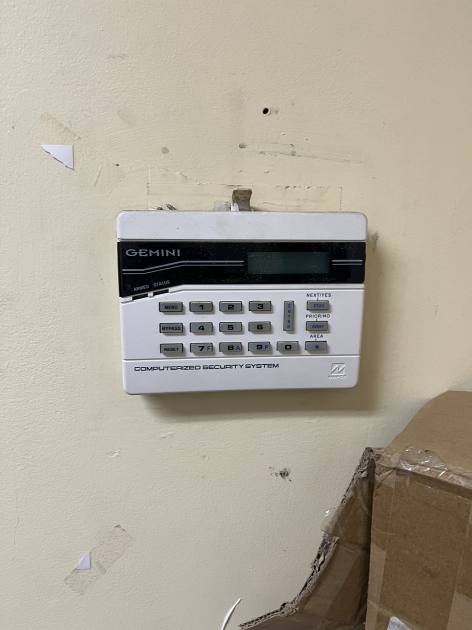
Additional Photos
Listing Agents

Shlomi Bagdadi
O: 718-437-6100
info@tristatecr.com
O: 718-437-6100
info@tristatecr.com
While we strive to provide the most accurate information, all listing information, and demographic data, is provided by third-parties. As such, MyEListing will not be responsible for the accuracy of the information. It is strongly recommended that you verify all information with the listing agent, and any relevant agencies, prior to making any decisions.