Office Space
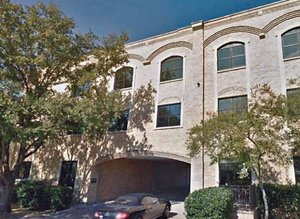
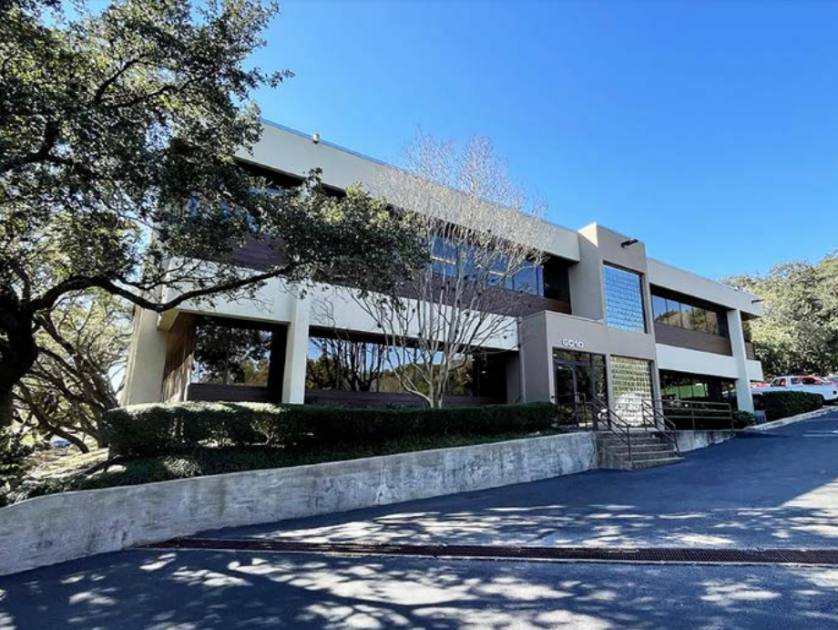
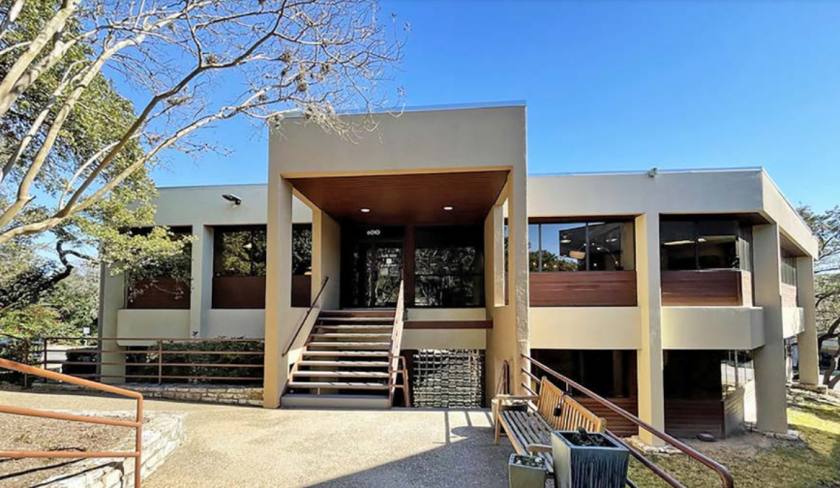
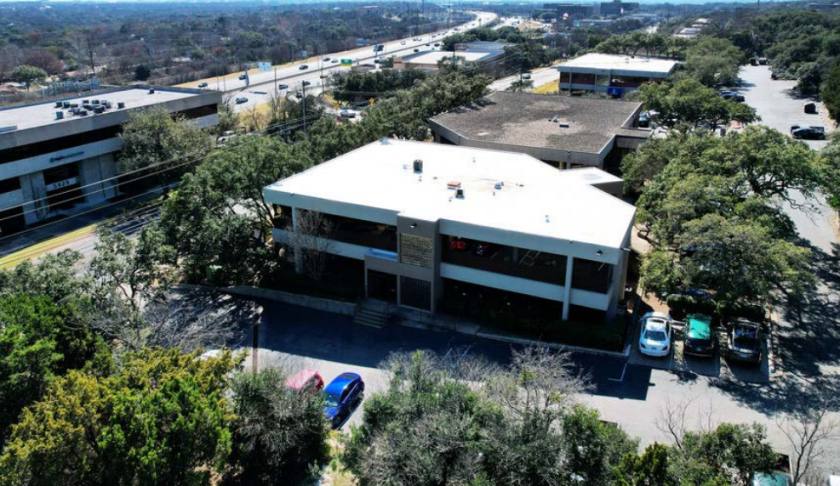
6010 Balcones Drive Austin, TX 78731
6010 Balcones Drive Austin, TX 78731
Details & Description
Property Highlights
- • $20.00 PSF + $13.07 OPERATING EXPENSES
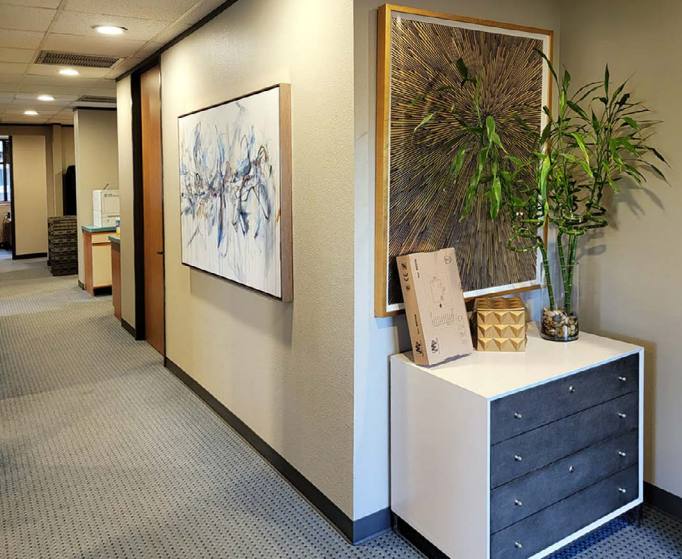
- • Lobby Exposure
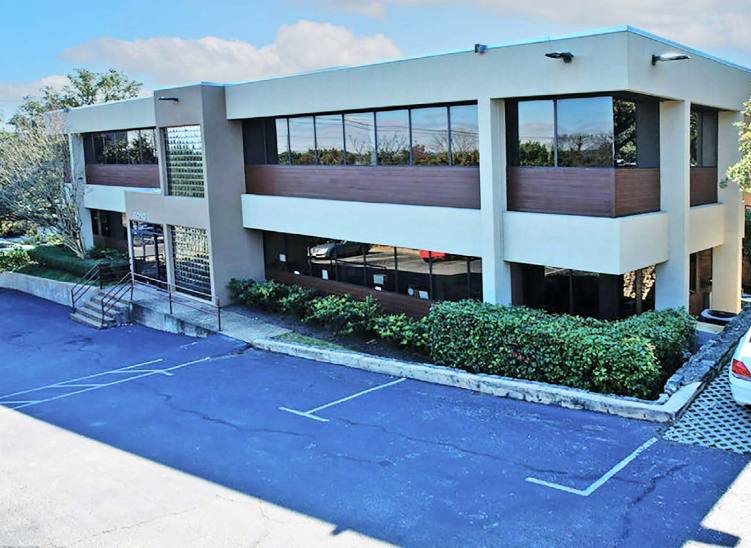
- • Easy Access to Parking
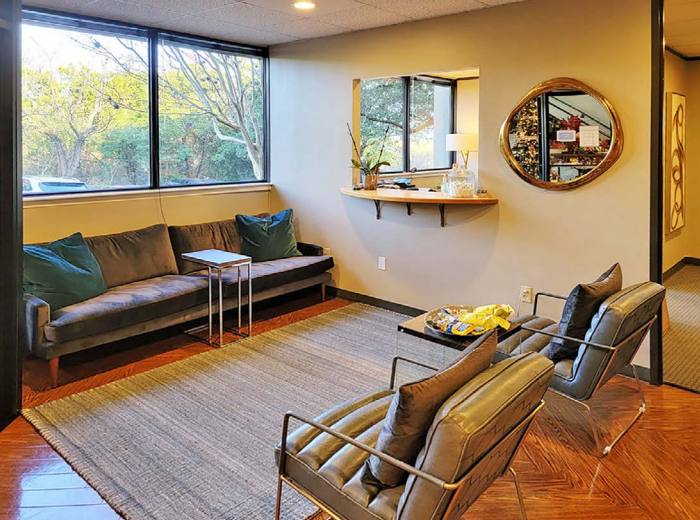
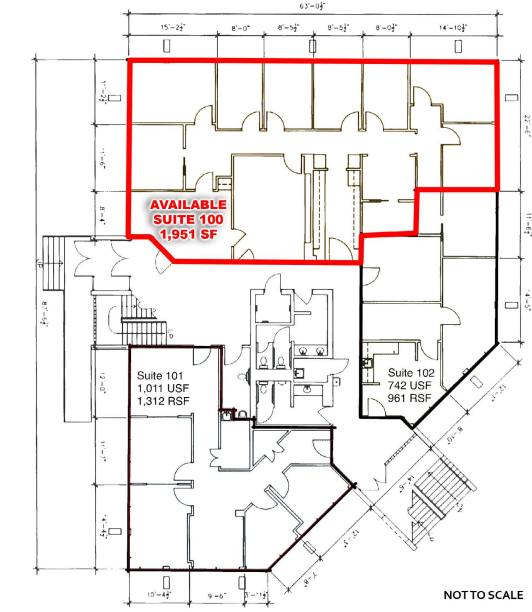
- • Reception
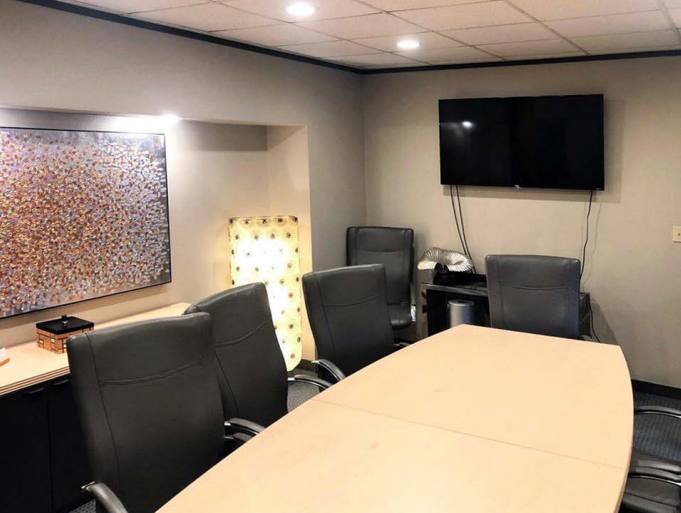
- • Conference Room
- • Common Area Restrooms
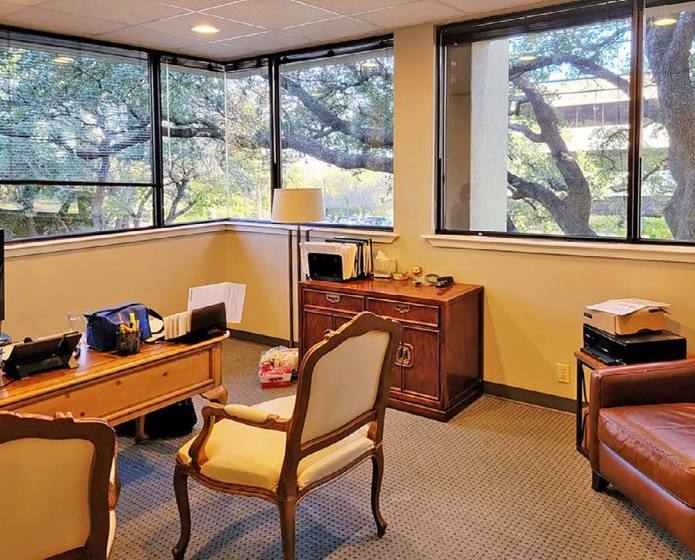
Additional Photos
Listing Agents

Brian Novy
O: 512-750-5587
novyco@austin.rr.com
O: 512-750-5587
novyco@austin.rr.com
While we strive to provide the most accurate information, all listing information, and demographic data, is provided by third-parties. As such, MyEListing will not be responsible for the accuracy of the information. It is strongly recommended that you verify all information with the listing agent, and any relevant agencies, prior to making any decisions.