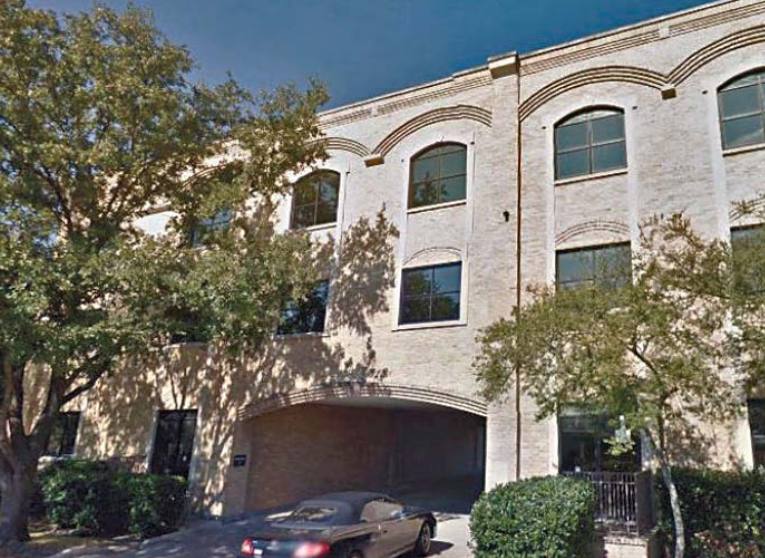
Office Space
3901 Medical Parkway, 300 Austin, TX 78756
3901 Medical Parkway, 300 Austin, TX 78756
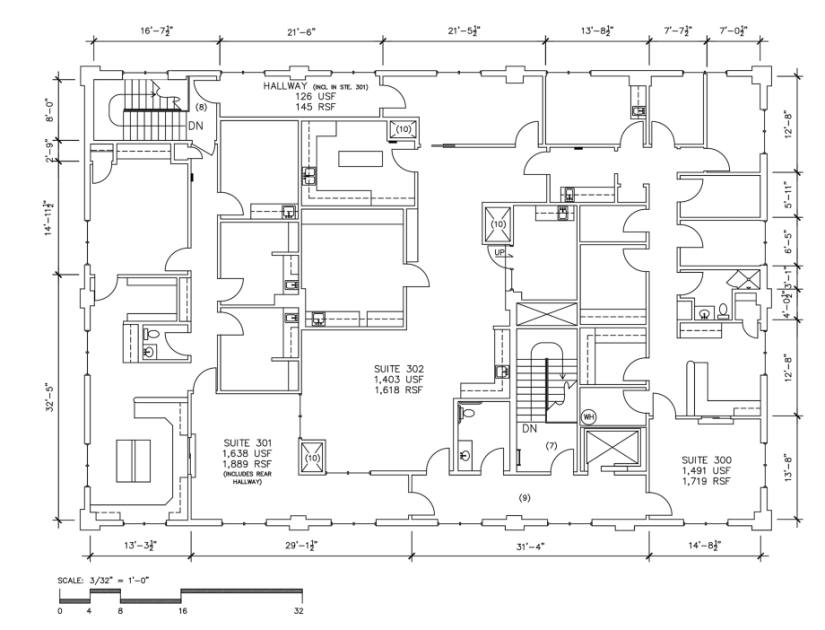
Details & Description
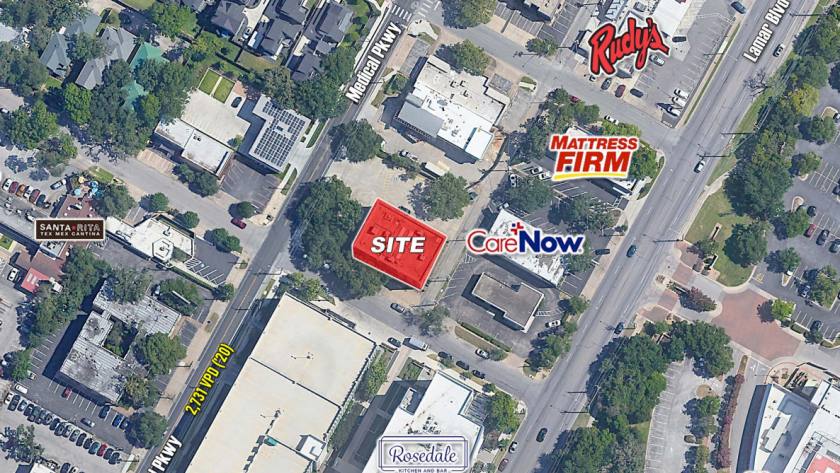
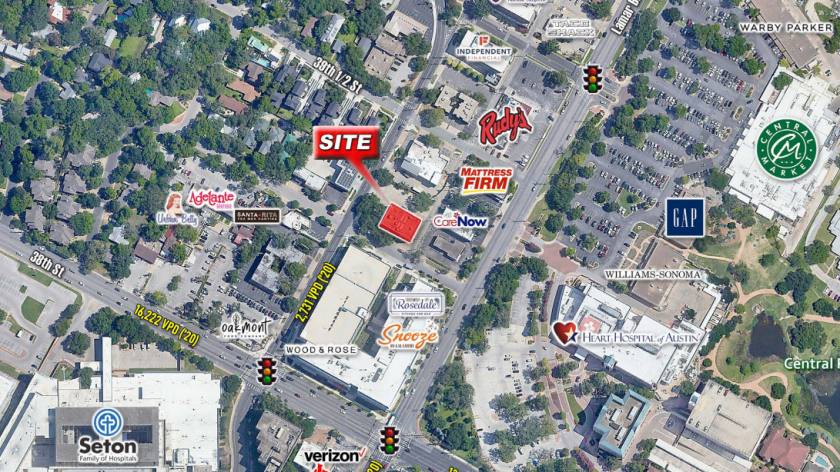
Property Highlights
• Close proximity to The Grove, The Triangle, Whitaker Sports Complex, Hancock Golf Course
• Convenient to: Lamar Central, Central Market, and Austin Radiological Association
Additional Photos
Listing Agents

Brian Novy
O: 512-750-5587
novyco@austin.rr.com
O: 512-750-5587
novyco@austin.rr.com
While we strive to provide the most accurate information, all listing information, and demographic data, is provided by third-parties. As such, MyEListing will not be responsible for the accuracy of the information. It is strongly recommended that you verify all information with the listing agent, and any relevant agencies, prior to making any decisions.


