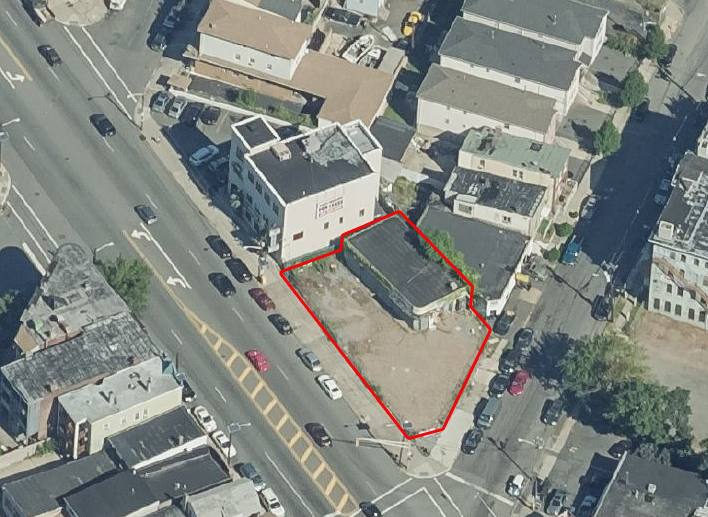
Lot Size at ±0.23 Acres (Block 1972, Lot 16)
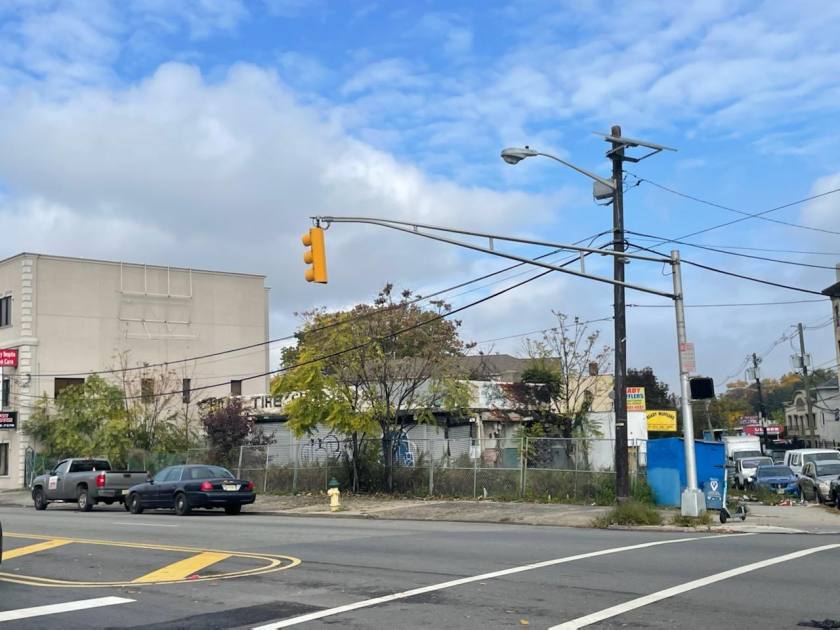
Next to Bus Stop (NJ Transit Bus 11, 28, 29 and 72)
Busy Corner Lot Location with Traffic Light
One Block to Bloomfield Avenue Light Rail Station
Nearby Retailers Include Restaurants, Convenience Stores, Salons, Pharmacies and Grocery Stores
Taxes at $12,221 (2022)
Commercial Land Use
Approx. 1.5 Miles to I-280
Approx. 4.5 Miles to NJ Turnpike
Approx. 12.4 Miles to Newark Liberty International Airport
No part of this information may be copied, reproduced, repurposed, or screen-captured for any commercial purpose without prior written authorization from MyEListing.
While we strive to provide the most accurate information, all listing information, and demographic data, is provided by third-parties. As such, MyEListing will not be responsible for the accuracy of the information. It is strongly recommended that you verify all information with the listing agent, and any relevant agencies, prior to making any decisions.
What is the asking price for 325-335 Bloomfield Avenue in Newark?
The asking price for 325-335 Bloomfield Avenue is $699,000
How much land does the Newark, NJ property at 325-335 Bloomfield Avenue include?
325-335 Bloomfield Avenue in Newark includes 0.230 acres of land
What kind of Land is the propery at 325-335 Bloomfield Avenue?
The property at 325-335 Bloomfield Avenue Newark, NJ 07107 is listed as a Mixed Use Land Land property
What is the population within 1 mile of 325-335 Bloomfield Avenue in Newark?
The population within 1 mile of 325-335 Bloomfield Avenue Newark, NJ 07107 is 66,073 people.
Who do I contact for questions about 325-335 Bloomfield Avenue?
You should contact the listing agent,
Juan Disla, for any details regarding this commercial listing.