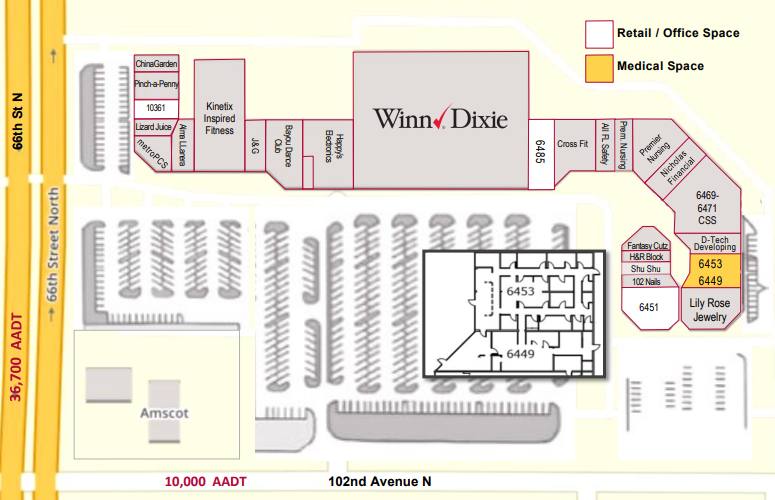
Retail / Office / Medical spaces in Winn Dixie anchored Center
Strong tenant mix including Winn Dixie, MetroPCS, China Garden, H&R Block, Kinetix Fitness and Pinch-A-Penny
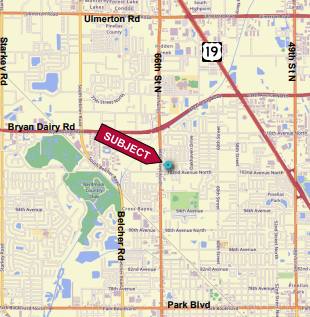
Located on hard corner of signalized intersection at 66th St N and 102 Ave N
Easy access from US 19 and I-275
5.2 / 1,000 parking ratio
Well maintained center
2024 Pass-Through expenses: $3.74/SF
Leasing Rates: $16.00 - $22.00/ SF / NNN
Retail / Office / Medical spaces in Winn Dixie anchored Center
1,305 SF to 5,400 SF Suites Available
Strong tenant mix including Winn Dixie, MetroPCS, China Garden, H&R Block, Pinch-A-Penny, Kinetix Fitness and more
High-volume Winn Dixie Marketplace store with completed major renovations and improvements
Located on hard corner of signalized intersection at 66th St N and 102nd Ave N
Easy access from US 19 and I-275
5.2 / 1,000 parking ratio
Well maintained center
2024 pass-through expenses: $3.74/SF
Leasing Rates: $16.00 - $22.00 /SF/NNN
No part of this information may be copied, reproduced, repurposed, or screen-captured for any commercial purpose without prior written authorization from MyEListing.
While we strive to provide the most accurate information, all listing information, and demographic data, is provided by third-parties. As such, MyEListing will not be responsible for the accuracy of the information. It is strongly recommended that you verify all information with the listing agent, and any relevant agencies, prior to making any decisions.
What is the building size of this commercial Retail property?
The size of this multi-unit property varies between 1305 - 4800 square feet
What kind of Retail is the propery at 6501 102nd Avenue North?
The property at 6501 102nd Avenue North Pinellas Park, FL 33782 is listed as a Shopping Center Retail property
What is the population within 1 mile of 6501 102nd Avenue North in Pinellas Park?
The population within 1 mile of 6501 102nd Avenue North Pinellas Park, FL 33782 is 10,796 people.
Who do I contact for questions about 6501 102nd Avenue North?
You should contact the listing agent,
Elliott Ross, for any details regarding this commercial listing.