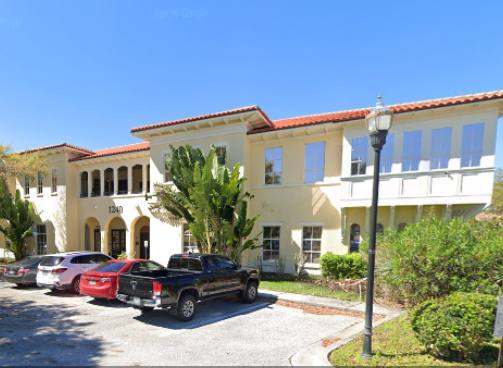
1-Mile | 3-Miles | 5-Miles | ||
---|---|---|---|---|
Total Population | 6,756 | 80,558 | 195,127 | |
Population Median Age | 31 | 37 | 37 | |
Population by Age | 0-9 Yrs | 706 (10%) | 9200 (11%) | 24308 (12%) |
10-19 Yrs | 704 (10%) | 8980 (11%) | 23875 (12%) | |
20-29 Yrs | 2082 (30%) | 14988 (18%) | 31232 (16%) | |
30-39 Yrs | 1470 (21%) | 13642 (16%) | 31091 (15%) | |
40-49 Yrs | 1016 (15%) | 10284 (12%) | 24885 (12%) | |
50-59 Yrs | 429 (6%) | 10064 (12%) | 25106 (12%) | |
60-69 Yrs | 157 (2%) | 7189 (8%) | 18426 (9%) | |
70+ Yrs | 192 (2%) | 6211 (7%) | 16204 (8%) | |
Median HH Income | $60,126 | $57,762 | $56,726 | |
Total Household Income | < 24K | 360 (11%) | 4921 (16%) | 13473 (18%) |
25-49K | 824 (27%) | 7905 (25%) | 17930 (24%) | |
50-74K | 723 (23%) | 6938 (22%) | 16157 (22%) | |
75-99K | 642 (21%) | 5164 (16%) | 10814 (14%) | |
100-199K | 412 (13%) | 4896 (16%) | 11909 (16%) | |
200K+ | 65 (2%) | 682 (2%) | 2080 (2%) | |
Highest Education Level | No Diploma | 330 | 6637 | 15407 |
Diploma or GED | 997 | 15268 | 39960 | |
Some College | 1011 | 11416 | 28848 | |
Assoc. Degree | 570 | 5609 | 13140 | |
Bachelors Degree | 1195 | 12155 | 26535 | |
Higher Degree | 645 | 5391 | 10514 | |
Total Housing Units | 3,367 | 32,968 | 78,095 | |
--Owner-Occupied | 160 | 12,802 | 38,734 | |
--Renter-Occupied | 2,866 | 17,703 | 33,630 | |
Owner-Occupied Values | < 100K | 8 | 1871 | 5865 |
100-199K | 102 | 6130 | 16194 | |
200-299K | 31 | 3854 | 12710 | |
300-399K | 7 | 551 | 2700 | |
400-499K | 5 | 286 | 729 | |
500K+ | 7 | 110 | 536 | |
Total Working Age Population | 5,647 | 66,162 | 156,181 | |
In Work Force | 4,602 | 44,375 | 102,178 | |
Not In Work Force | 1,045 | 21,786 | 54,003 | |
Workforce Employed | 4,237 | 42,043 | 96,468 | |
Workforce Unemployed | 315 | 2,217 | 5,239 | |
Civlian Workforce | 4,552 | 44,260 | 101,707 | |
Military Workforce | 50 | 115 | 471 | |
Total Households | 3,026 | 30,506 | 72,363 | |
Family Households | 1,209 | 17,704 | 45,737 | |
Non-Family Households | 1,817 | 12,802 | 26,626 | |
Married Couple | 618 | 10,522 | 27,807 | |
Other Family | 591 | 7,182 | 17,930 | |
Married w/Child | 215 | 3,832 | 10,251 | |
Single Male w/Child | 45 | 849 | 1,790 | |
Single Female w/Child | 374 | 2,610 | 7,345 |
Population Change Last Two Decades - Plus Projection
2000 | % | 2010 | % | 2020 | % | 2030 | |
---|---|---|---|---|---|---|---|
Florida | 15,982,378 | +18 | 18,801,310 | +14 | 21,517,610 | +13 | 24,340,457 |
Hillsborough County | 998,948 | +23 | 1,229,226 | +19 | 1,466,803 | +16 | 1,708,550 |
Total Working Age Population:
Total Households:
Total Working Age Population:
Total Households:
Total Working Age Population:
Total Households: