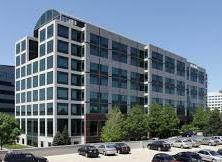
Office Space
3025 Highland Parkway Downers Grove, IL 60515
3025 Highland Parkway Downers Grove, IL 60515
Details & Description
Property Highlights
• 5th Floor, Suite 550
• APPROX. DESKS 64
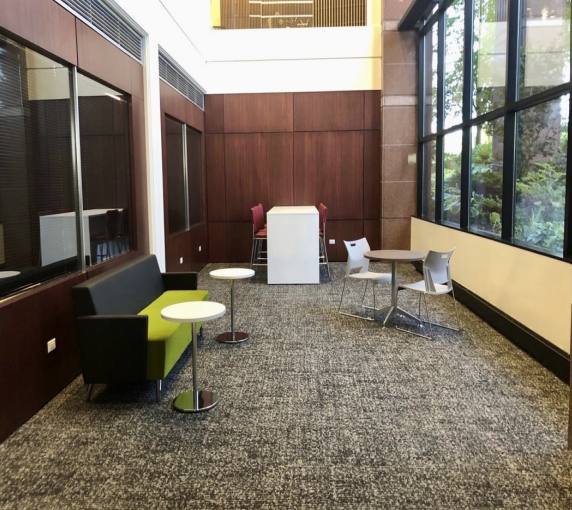
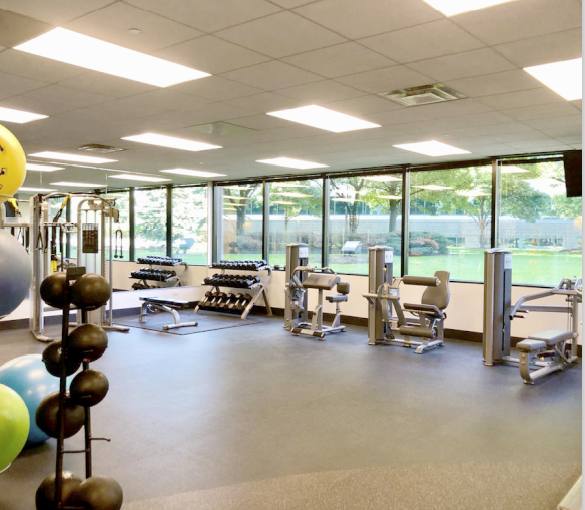
Additional Photos


Listing Agents

Jeff Shay
O: 773-858-1692
jeff.shay@jll.com
O: 773-858-1692
jeff.shay@jll.com

Jack Connors
JLL
O: 773-304-4112
jack.connors@jll.com
JLL
O: 773-304-4112
jack.connors@jll.com
While we strive to provide the most accurate information, all listing information, and demographic data, is provided by third-parties. As such, MyEListing will not be responsible for the accuracy of the information. It is strongly recommended that you verify all information with the listing agent, and any relevant agencies, prior to making any decisions.


