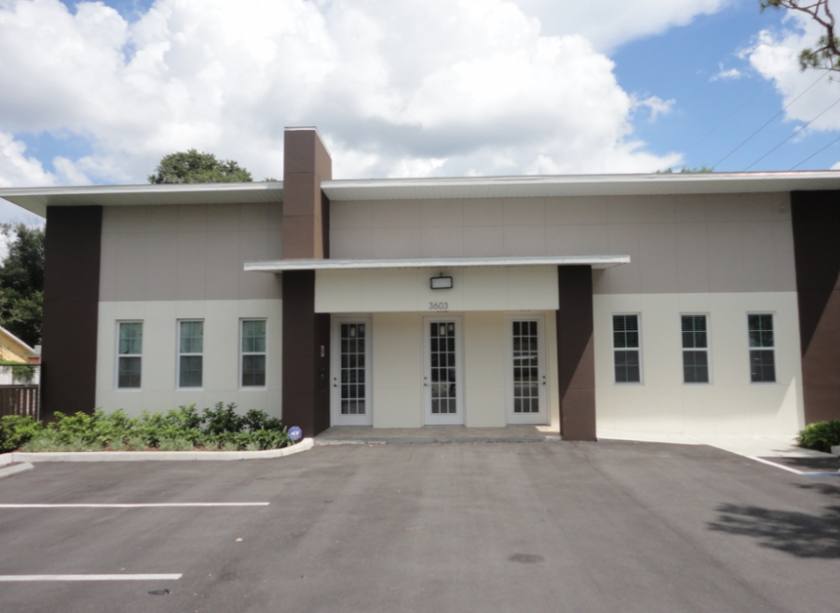
Office Space
7008 North Himes Avenue Tampa, FL 33614
7008 North Himes Avenue Tampa, FL 33614
Details & Description
Property Highlights
- • Year Built 2013
- • Great parking
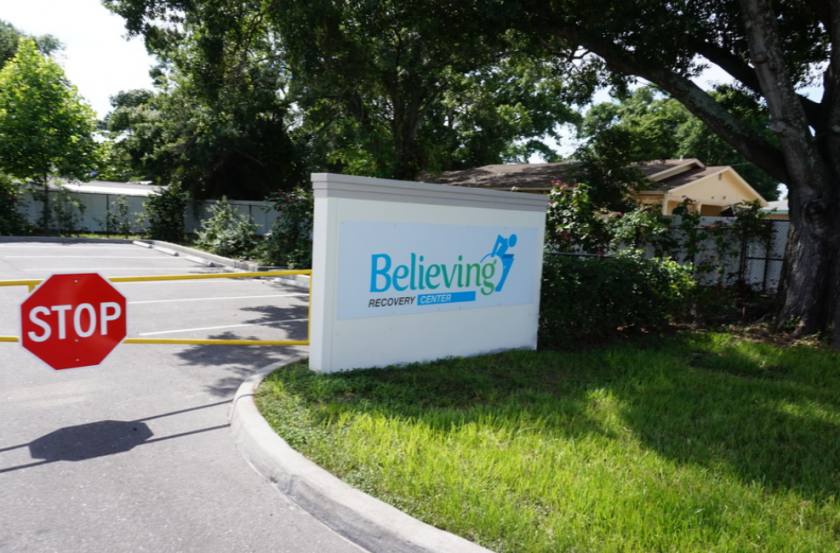
- • Signage on Himes Ave
- • Medical or professional users allowed
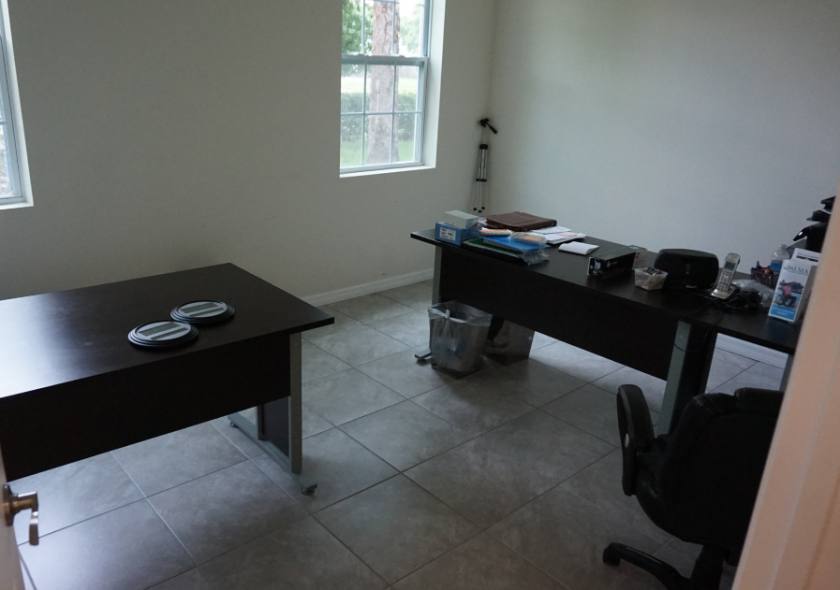
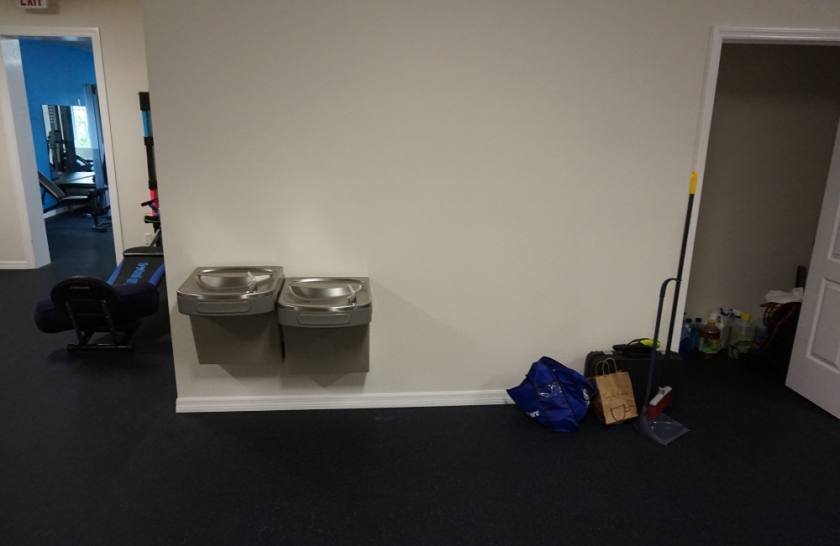
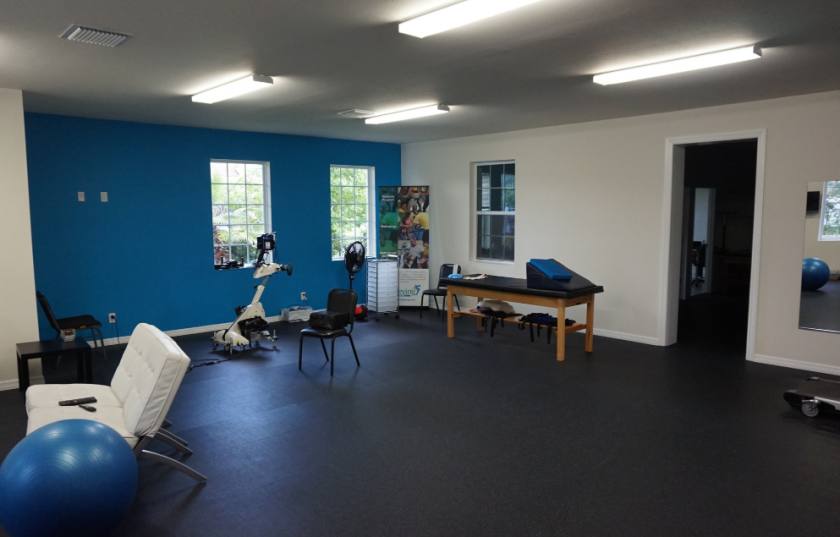
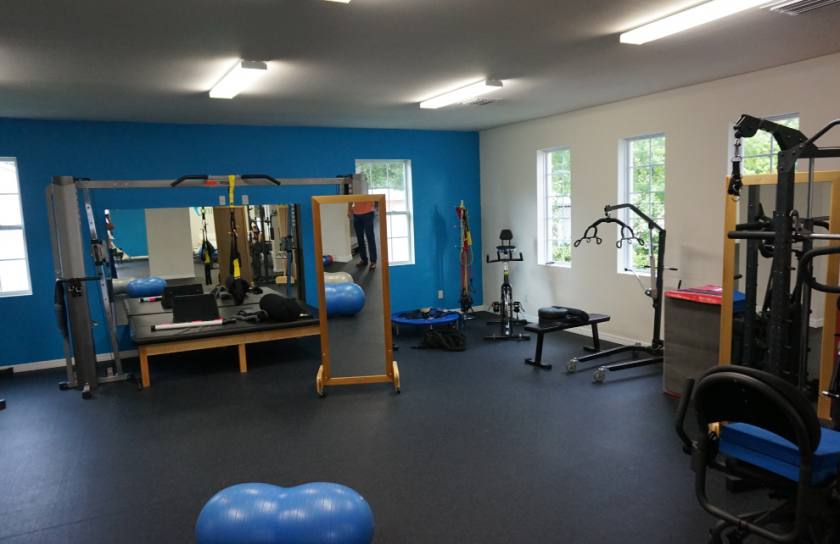
Additional Photos
Listing Agents

John Milsaps
O: 813-563-8666
john.milsaps@svn.com
O: 813-563-8666
john.milsaps@svn.com
While we strive to provide the most accurate information, all listing information, and demographic data, is provided by third-parties. As such, MyEListing will not be responsible for the accuracy of the information. It is strongly recommended that you verify all information with the listing agent, and any relevant agencies, prior to making any decisions.