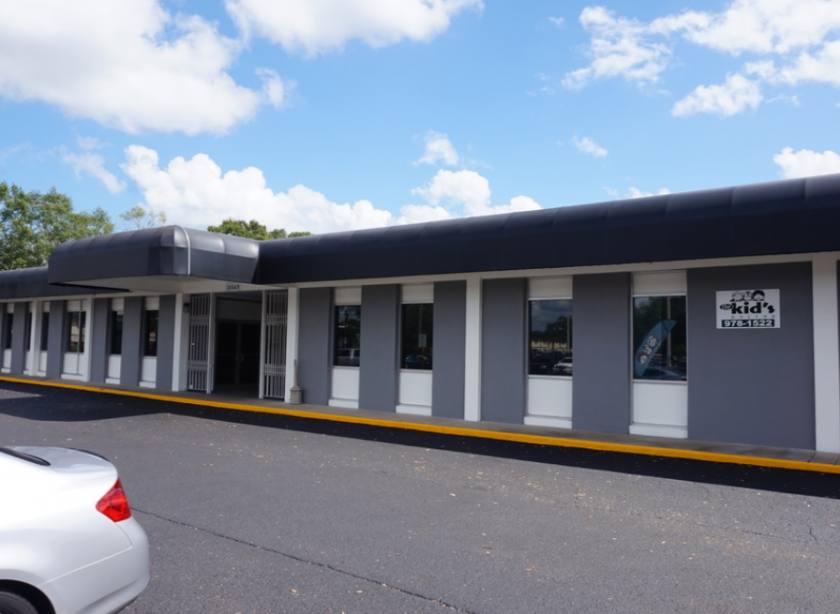
Office Space
10549 North Florida Avenue Tampa, FL 33612
10549 North Florida Avenue Tampa, FL 33612
Details & Description
Property Highlights
- • Year Built 1965
- • Ample parking
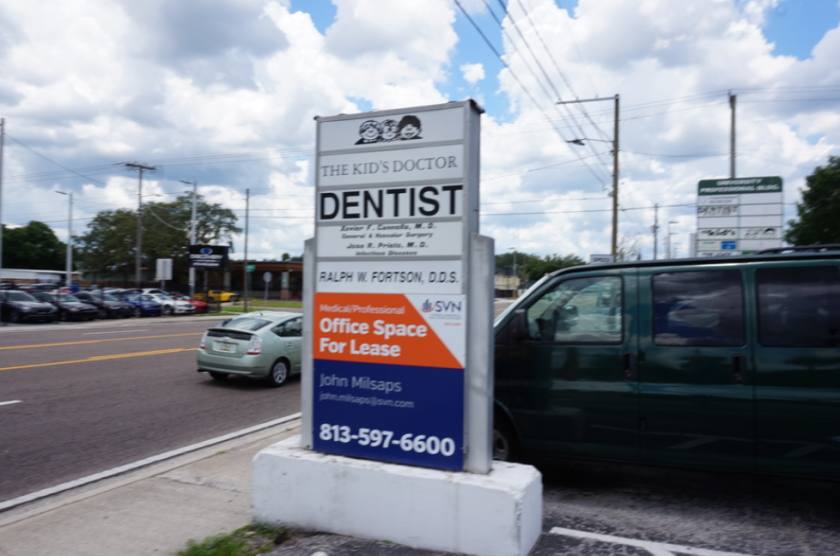
- • Signage on N. Florida Ave
- • Great access to I-275
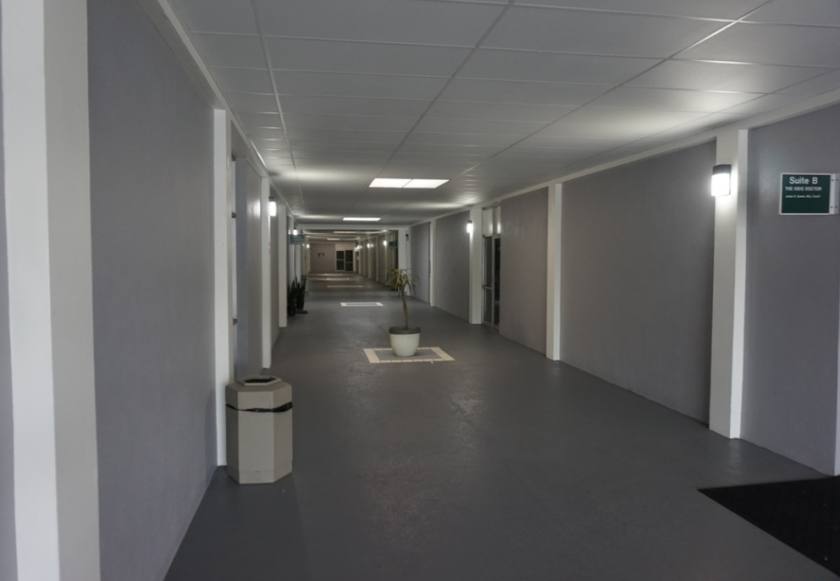
- • Professionally managed office complex
Additional Photos

Listing Agents

John Milsaps
O: 813-563-8666
john.milsaps@svn.com
O: 813-563-8666
john.milsaps@svn.com
While we strive to provide the most accurate information, all listing information, and demographic data, is provided by third-parties. As such, MyEListing will not be responsible for the accuracy of the information. It is strongly recommended that you verify all information with the listing agent, and any relevant agencies, prior to making any decisions.


