Commercial Land
11487 U.S. 301 Thonotosassa, FL 33592
11487 U.S. 301 Thonotosassa, FL 33592

Details & Description
Property Highlights
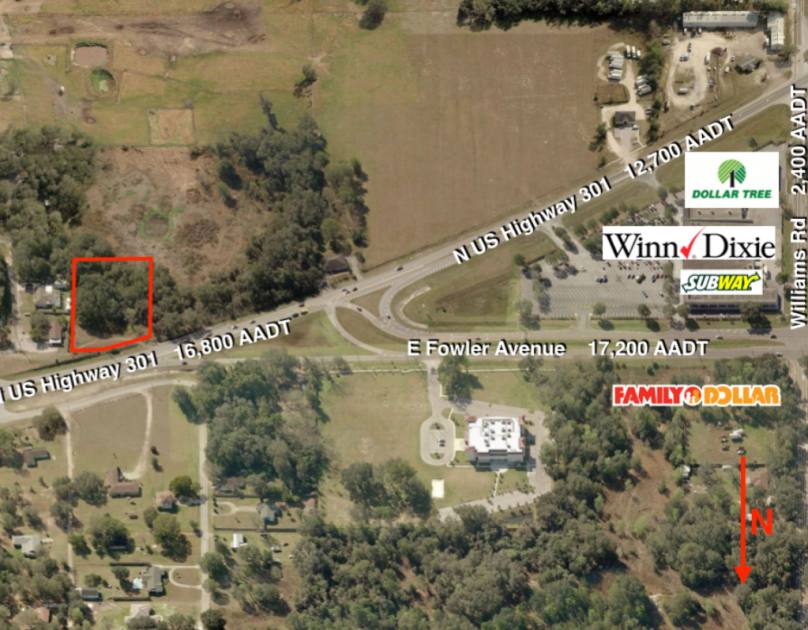
• This property is ideally situated on US 301 and is ready to be rezoned and developed into a retail or office use.
• It is just north of the newly reconfigured intersection and the Winn Dixie anchored shopping center.
Additional Photos


Listing Agents

Ryan Sampson
O: 813-287-8787
M: 813-417-5928
ryan@thedirtdog.com
O: 813-287-8787
M: 813-417-5928
ryan@thedirtdog.com
While we strive to provide the most accurate information, all listing information, and demographic data, is provided by third-parties. As such, MyEListing will not be responsible for the accuracy of the information. It is strongly recommended that you verify all information with the listing agent, and any relevant agencies, prior to making any decisions.


