Office Space
4144 North Armenia Avenue Tampa, FL 33607
4144 North Armenia Avenue Tampa, FL 33607

Details & Description
Property Highlights
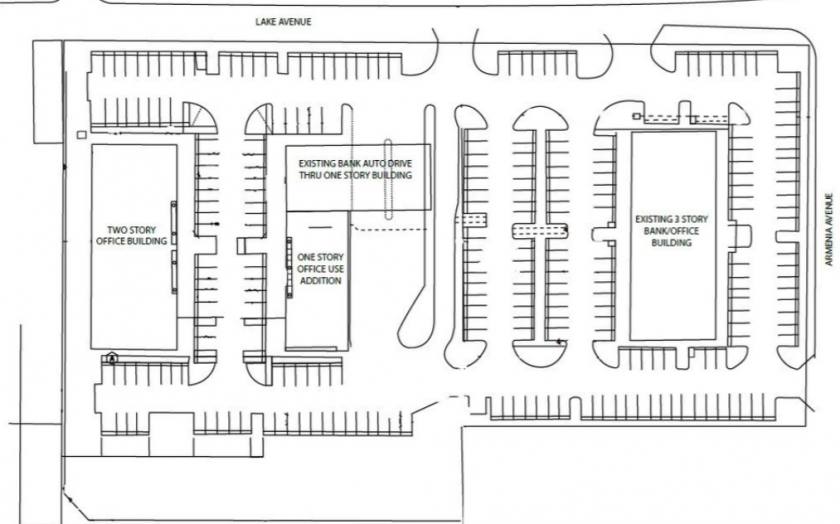
- • On-site bank (BB & T)
- • Professionally managed
- • Great Tenant Mix
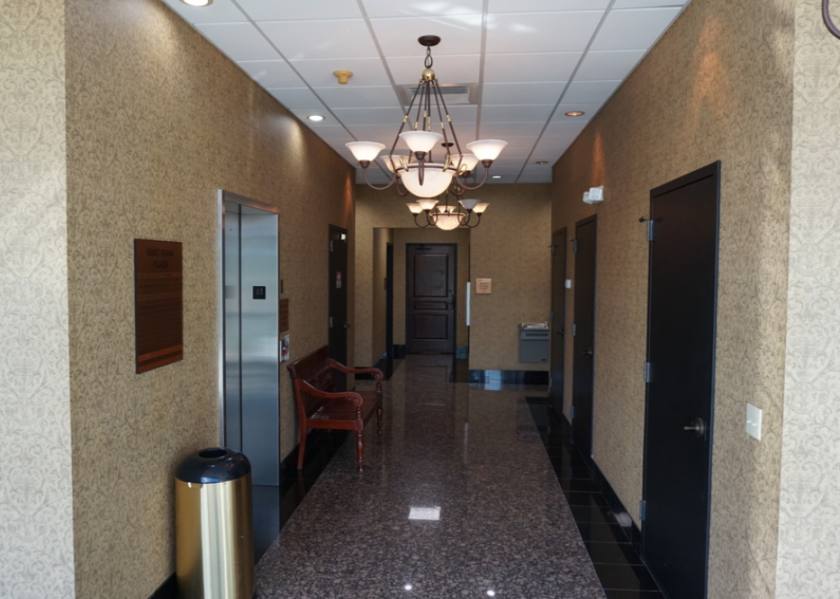
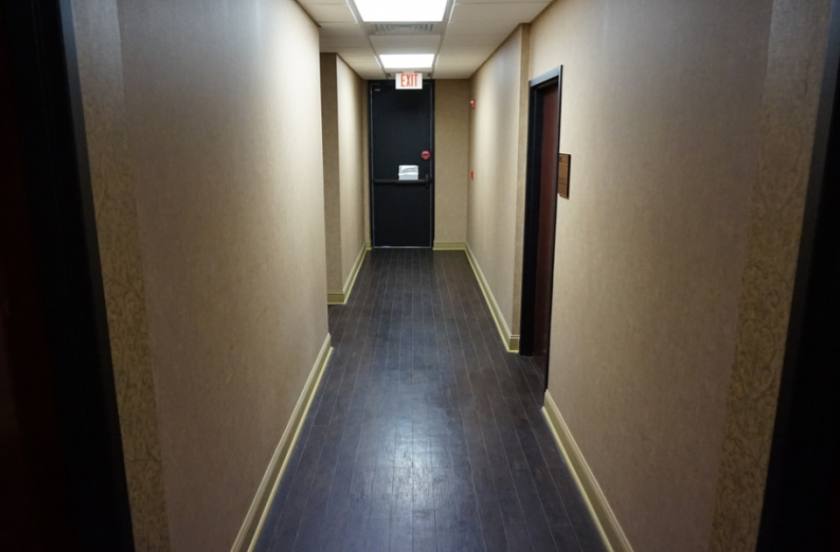
- • Renovated lobbies
Additional Photos
Listing Agents

John Milsaps
O: 813-563-8666
john.milsaps@svn.com
O: 813-563-8666
john.milsaps@svn.com
While we strive to provide the most accurate information, all listing information, and demographic data, is provided by third-parties. As such, MyEListing will not be responsible for the accuracy of the information. It is strongly recommended that you verify all information with the listing agent, and any relevant agencies, prior to making any decisions.


