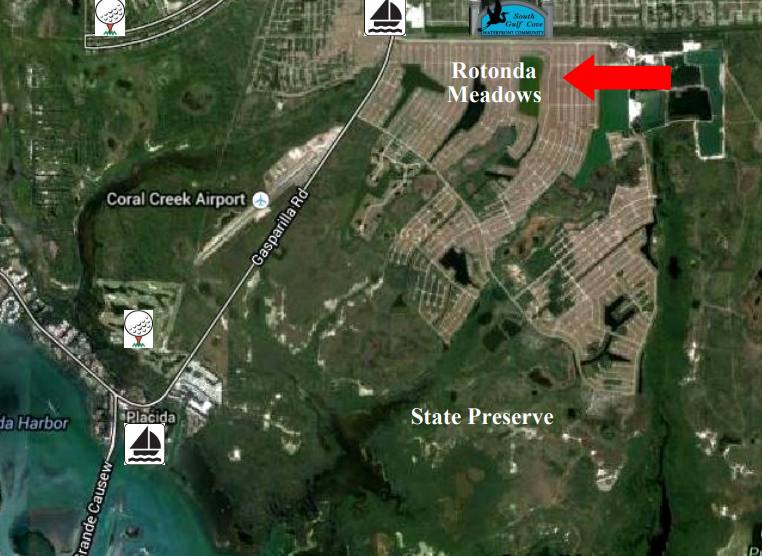
SITE OPPORTUNITY: 86 Single family building lots located in the Rotonda Meadows/ Villas subdivision in Placida, Florida. The Rotonda Meadows/Villas is a deed restricted community located adjacent to over 6,000+ acres of Charlotte Harbor State Preserve. All lots have central water and sewer in place and are permit ready with storm water plan approved and constructed. There is an active Homeowner’s Association with updated deed restrictions.
LOCATION: Located on the tip of Cape Haze on the Gulf of Mexico on Florida’s West Coast. Minutes from area beaches and upscale areas such as Boca Grande, Manasota Beach, Murdock Mall and the Tampa Bay Rays spring training facility.The area has over 6+ golf courses and great access to fishing, shopping and leisure activities.
ZONING: All lots are zoned RSF and allow a single family home.
ACCESS: Easy access off of Hwy 771 in the Rotonda Area. All roads are public, paved roads.
PARCEL ID: See Attached
BUILD STANDARDS: Minimum 1,400 sf. of living area. House must have two car garage with 400+ sqft. of garage area. All design standards are reviewed and approved by the HOA.
UTILITIES: All lots have water & sewer serviced by Charlotte County Utilities. Power to be provided by Florida Power & Light.
ENVIRONMENTAL: No known issues of concern. A HUD Statement for the subdivision is available through the Homeowner’s Association. No Scrub Jay territory per Charlotte County Scrub Jay Review.
ADDITIONAL INFO: Active mandatory Homeowner’s Association. Fee is $90 per year and is subject to change on a yearly basis. Deed Restrictions and subdivision information can be found at: www.rotondameadowsvillas.com
No part of this information may be copied, reproduced, repurposed, or screen-captured for any commercial purpose without prior written authorization from MyEListing.
While we strive to provide the most accurate information, all listing information, and demographic data, is provided by third-parties. As such, MyEListing will not be responsible for the accuracy of the information. It is strongly recommended that you verify all information with the listing agent, and any relevant agencies, prior to making any decisions.
What is the asking price for Rotonda Trace Blvd in Placida?
The asking price for Rotonda Trace Blvd is $1,720,000
How much land does the Placida, FL property at Rotonda Trace Blvd include?
Rotonda Trace Blvd in Placida includes 15.000 acres of land
What kind of Land is the propery at Rotonda Trace Blvd?
The property at Rotonda Trace Blvd Placida, FL 33946 is listed as a Single Family Land Land property
What is the population within 1 mile of Rotonda Trace Blvd in Placida?
The population within 1 mile of Rotonda Trace Blvd Placida, FL 33946 is 156 people.
Who do I contact for questions about Rotonda Trace Blvd?
You should contact the listing agent,
Sage Andress, for any details regarding this commercial listing.