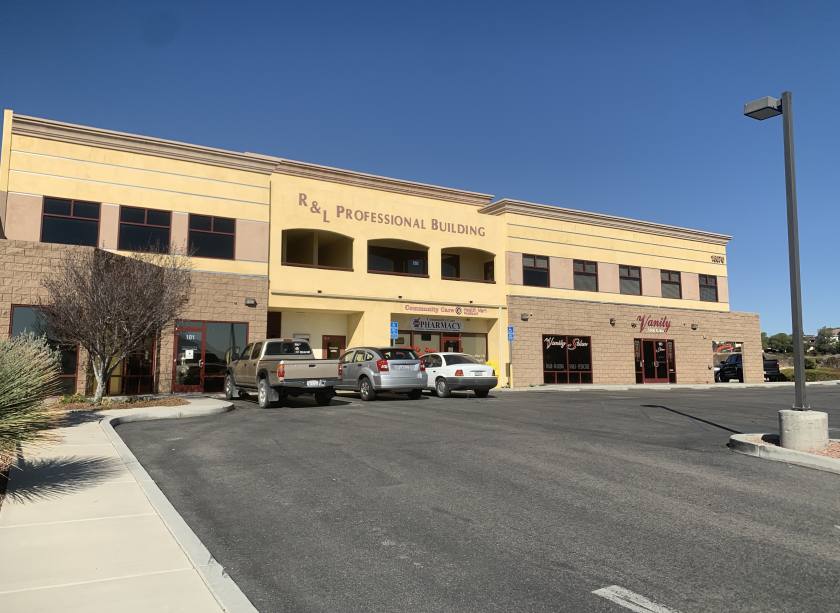
Office Space
16070 Tuscola Road Apple Valley, CA 92307
16070 Tuscola Road Apple Valley, CA 92307
Details & Description
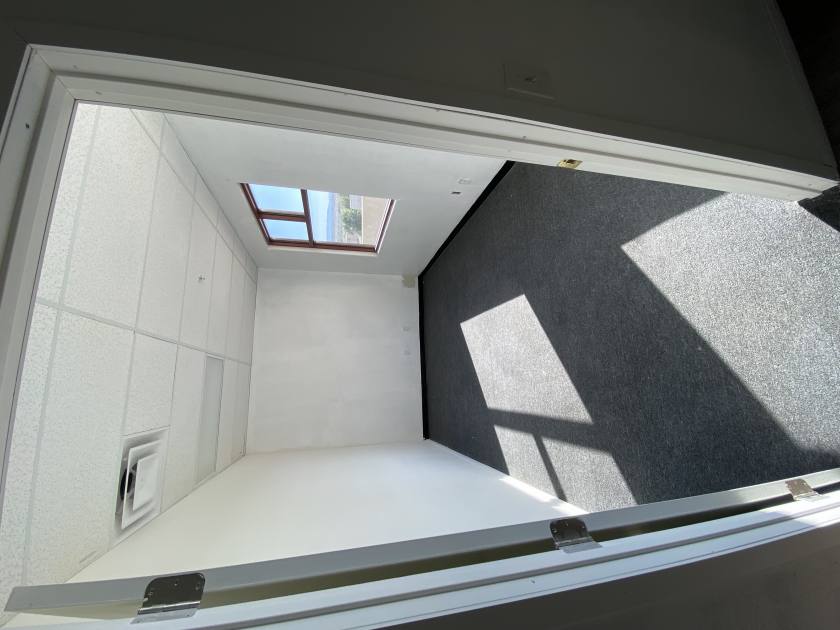
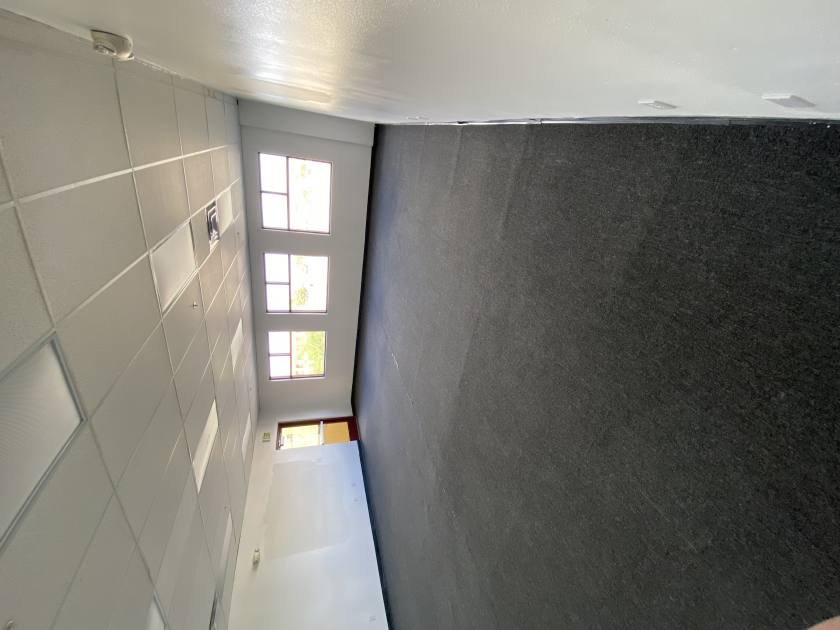
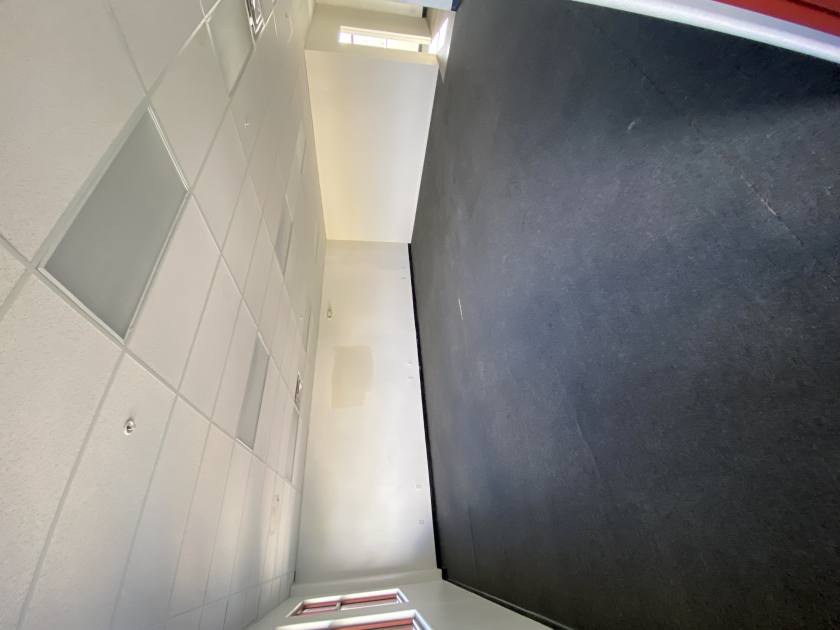
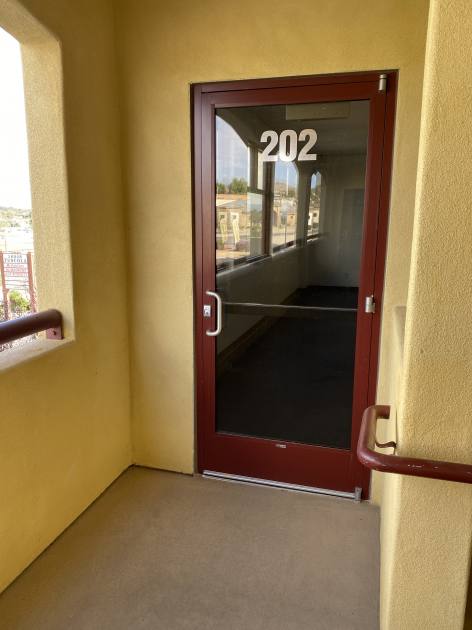
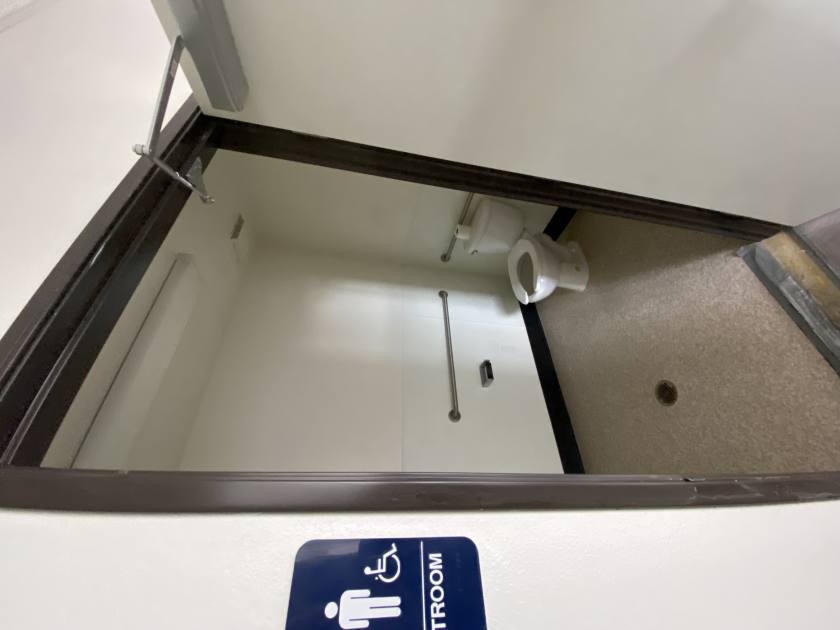
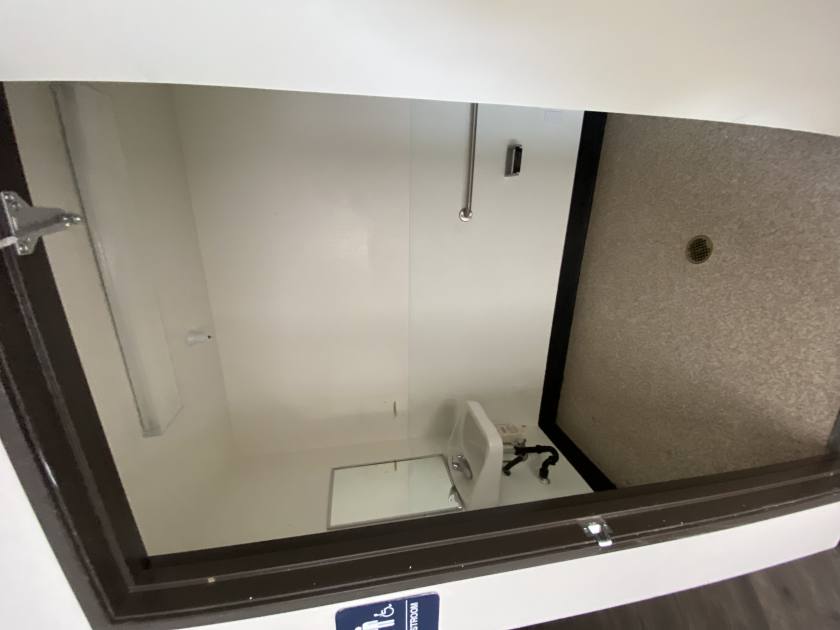
Additional Photos

Listing Agents

Tony Scafidi
M: 760-350-3772
tscafidi@rigelcap.com
M: 760-350-3772
tscafidi@rigelcap.com
While we strive to provide the most accurate information, all listing information, and demographic data, is provided by third-parties. As such, MyEListing will not be responsible for the accuracy of the information. It is strongly recommended that you verify all information with the listing agent, and any relevant agencies, prior to making any decisions.