Industrial Properties
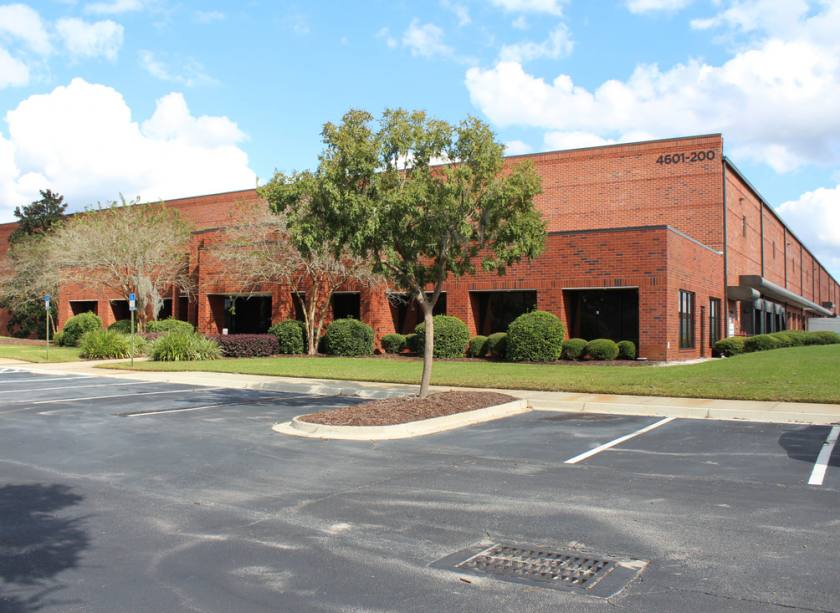
4601 Bulls Bay Highway Jacksonville, FL 32219
4601 Bulls Bay Highway Jacksonville, FL 32219
Details & Description
Property Highlights
- • Site Area: 4.9 Acres
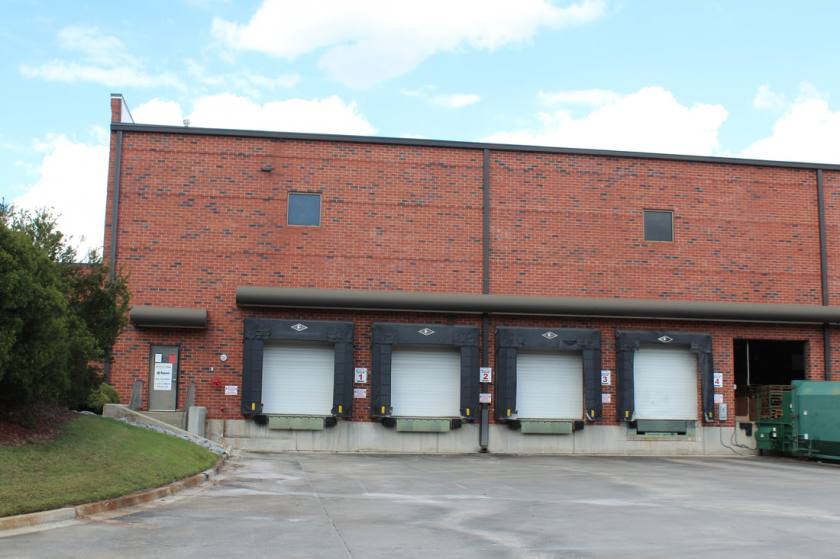
- • Clear Height: 30'
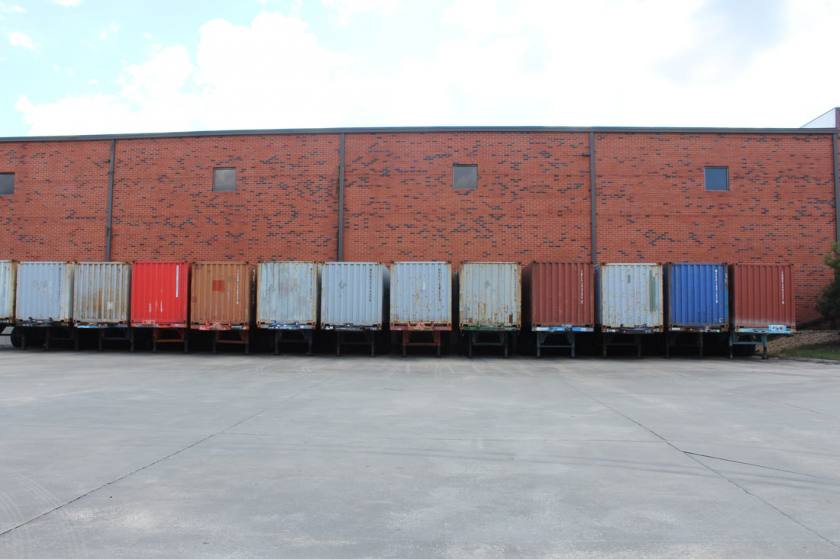
- • Docks: 10 (4 Additional Can Be Added)
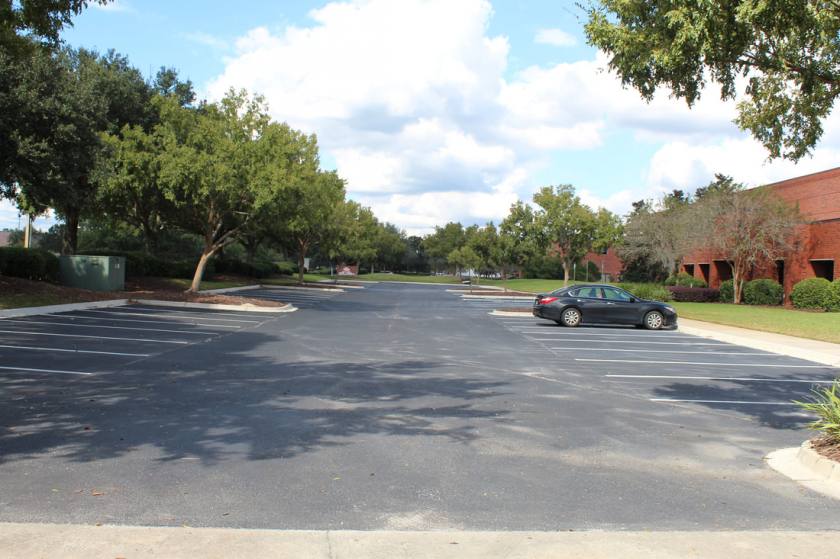
- • Auto Parking: 67
- • Truck Court: 185' shared
- • Year Built: 2000
Additional Photos


Listing Agents

Jacob Horsley
O: 904-380-8335
jacob.horsley@cushwake.com
O: 904-380-8335
jacob.horsley@cushwake.com

Tyler Newman
Cushman and Wakefield
O: 904-380-8336
tyler.newman@cushwake.com
Cushman and Wakefield
O: 904-380-8336
tyler.newman@cushwake.com
While we strive to provide the most accurate information, all listing information, and demographic data, is provided by third-parties. As such, MyEListing will not be responsible for the accuracy of the information. It is strongly recommended that you verify all information with the listing agent, and any relevant agencies, prior to making any decisions.