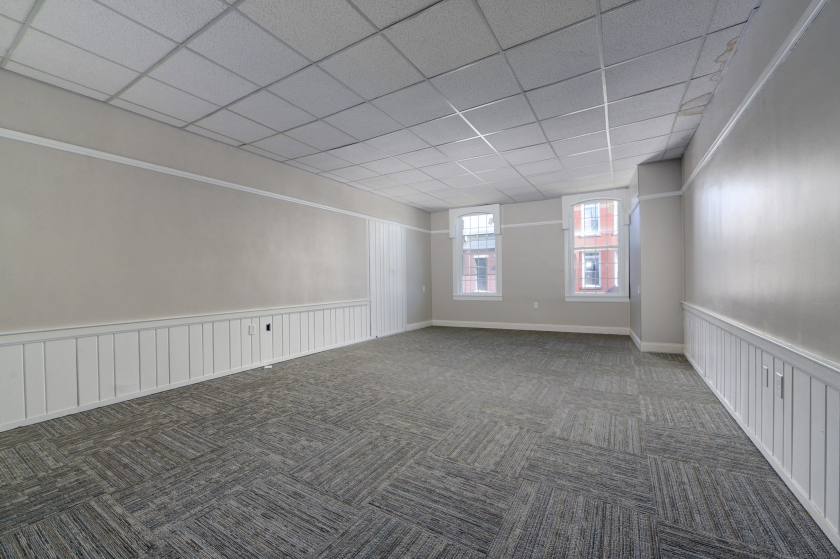
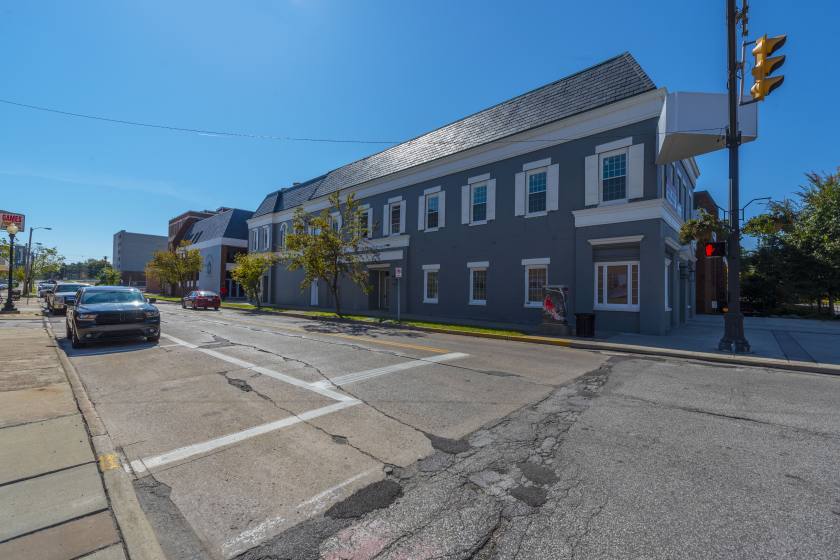
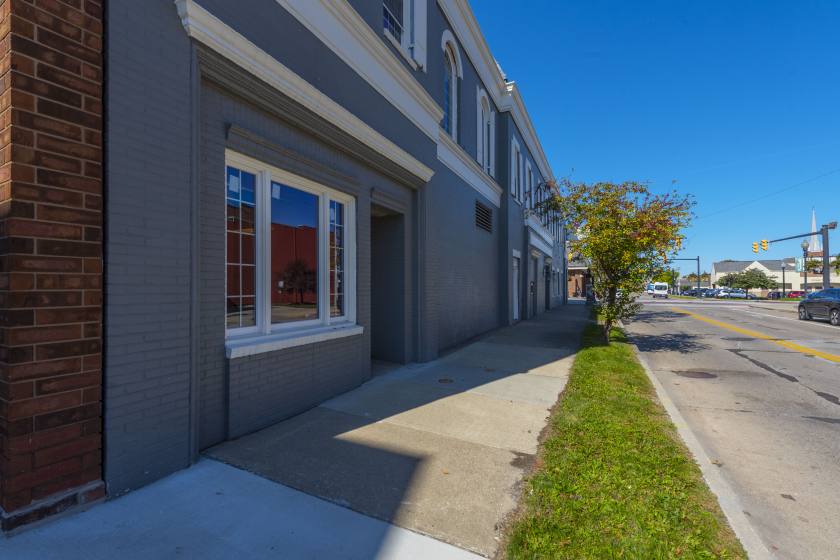
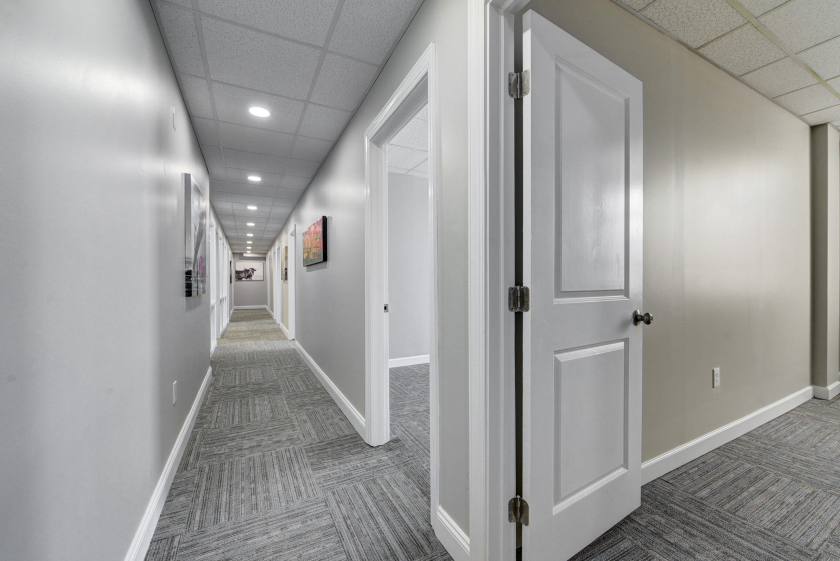
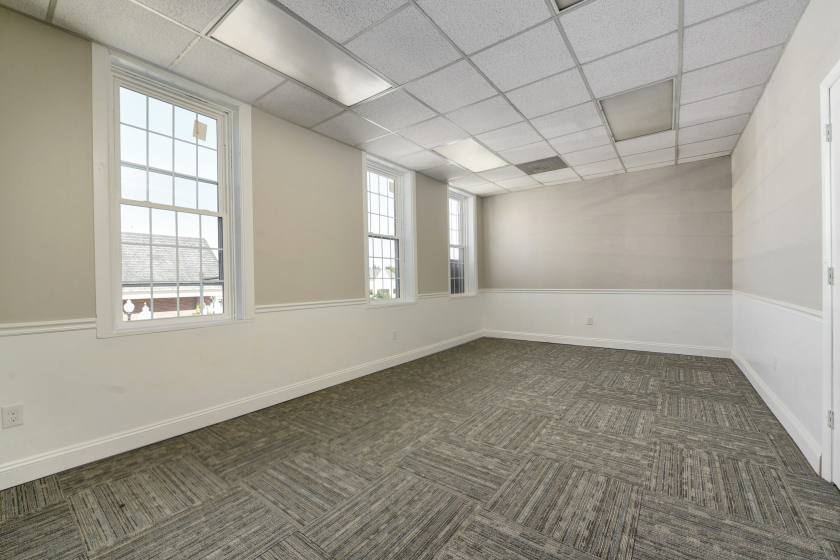
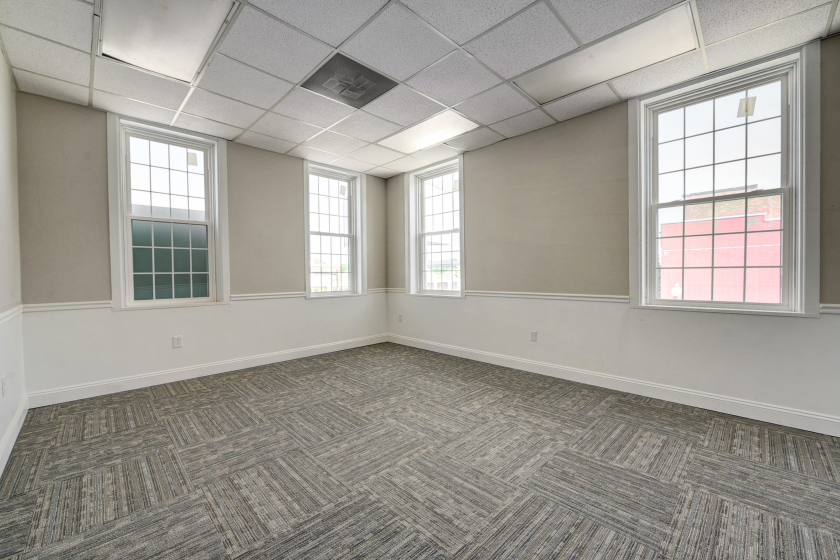
1-Mile | 3-Miles | 5-Miles | ||
---|---|---|---|---|
Total Population | 10,610 | 40,866 | 71,790 | |
Population Median Age | 33 | 38 | 41 | |
Population by Age | 0-9 Yrs | 1855 (17%) | 5672 (13%) | 8809 (12%) |
10-19 Yrs | 1730 (16%) | 5523 (13%) | 9345 (13%) | |
20-29 Yrs | 1628 (15%) | 4890 (11%) | 7294 (10%) | |
30-39 Yrs | 1280 (12%) | 5029 (12%) | 8242 (11%) | |
40-49 Yrs | 1394 (13%) | 5709 (13%) | 9847 (13%) | |
50-59 Yrs | 1031 (9%) | 5012 (12%) | 9385 (13%) | |
60-69 Yrs | 958 (9%) | 5021 (12%) | 10035 (13%) | |
70+ Yrs | 734 (6%) | 4009 (9%) | 8832 (12%) | |
Median HH Income | $40,247 | $57,442 | $68,342 | |
Total Household Income | < 24K | 1100 (30%) | 3177 (19%) | 4593 (16%) |
25-49K | 1056 (28%) | 3877 (24%) | 5924 (20%) | |
50-74K | 751 (20%) | 2904 (18%) | 4969 (17%) | |
75-99K | 390 (10%) | 2438 (15%) | 4519 (15%) | |
100-199K | 347 (9%) | 3303 (20%) | 6962 (24%) | |
200K+ | 16 (0%) | 322 (2%) | 1421 (5%) | |
Highest Education Level | No Diploma | 1371 | 2964 | 4142 |
Diploma or GED | 2375 | 8773 | 15274 | |
Some College | 1259 | 6122 | 11289 | |
Assoc. Degree | 472 | 3065 | 5111 | |
Bachelors Degree | 548 | 4049 | 8333 | |
Higher Degree | 250 | 2231 | 5836 | |
Total Housing Units | 3,909 | 17,282 | 30,383 | |
--Owner-Occupied | 1,464 | 10,351 | 21,211 | |
--Renter-Occupied | 2,195 | 5,669 | 7,177 | |
Owner-Occupied Values | < 100K | 629 | 2705 | 4277 |
100-199K | 711 | 4920 | 8592 | |
200-299K | 104 | 2268 | 6131 | |
300-399K | 19 | 301 | 1387 | |
400-499K | 0 | 88 | 425 | |
500K+ | 1 | 68 | 399 | |
Total Working Age Population | 7,847 | 32,093 | 57,406 | |
In Work Force | 4,492 | 20,678 | 36,201 | |
Not In Work Force | 3,355 | 11,415 | 21,205 | |
Workforce Employed | 4,229 | 19,274 | 34,040 | |
Workforce Unemployed | 255 | 1,389 | 2,145 | |
Civlian Workforce | 4,484 | 20,663 | 36,185 | |
Military Workforce | 8 | 15 | 16 | |
Total Households | 3,659 | 16,020 | 28,388 | |
Family Households | 2,059 | 9,784 | 18,579 | |
Non-Family Households | 1,601 | 6,236 | 9,809 | |
Married Couple | 1,173 | 6,846 | 13,861 | |
Other Family | 885 | 2,938 | 4,718 | |
Married w/Child | 520 | 2,547 | 4,915 | |
Single Male w/Child | 166 | 439 | 680 | |
Single Female w/Child | 416 | 1,283 | 1,828 |
Population Change Last Two Decades - Plus Projection
2000 | % | 2010 | % | 2020 | % | 2030 | |
---|---|---|---|---|---|---|---|
Ohio | 11,353,140 | +2 | 11,536,504 | 0 | 11,574,870 | 0 | 11,615,100 |
Lake County | 227,511 | +1 | 230,041 | -1 | 228,600 | 0 | 228,380 |
Total Working Age Population:
Total Households:
Total Working Age Population:
Total Households:
Total Working Age Population:
Total Households: