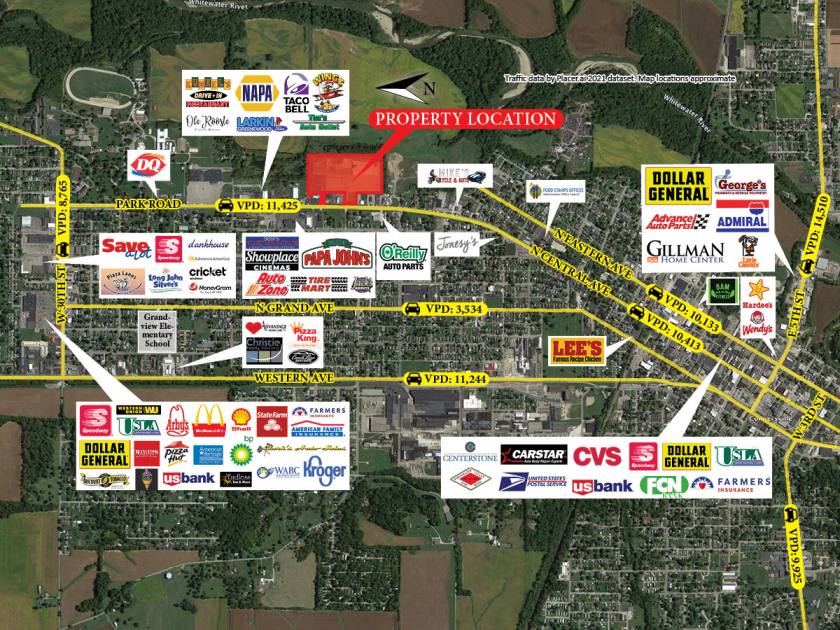
1-Mile | 3-Miles | 5-Miles | ||
---|---|---|---|---|
Total Population | 5,235 | 14,039 | 17,308 | |
Population Median Age | 40 | 41 | 42 | |
Population by Age | 0-9 Yrs | 561 (10%) | 1429 (10%) | 1681 (9%) |
10-19 Yrs | 695 (13%) | 1982 (14%) | 2487 (14%) | |
20-29 Yrs | 850 (16%) | 1809 (12%) | 2054 (11%) | |
30-39 Yrs | 515 (9%) | 1361 (9%) | 1643 (9%) | |
40-49 Yrs | 704 (13%) | 1736 (12%) | 2233 (12%) | |
50-59 Yrs | 476 (9%) | 1844 (13%) | 2408 (13%) | |
60-69 Yrs | 778 (14%) | 1974 (14%) | 2488 (14%) | |
70+ Yrs | 655 (12%) | 1904 (13%) | 2314 (13%) | |
Median HH Income | $40,089 | $40,559 | $44,168 | |
Total Household Income | < 24K | 761 (32%) | 1979 (32%) | 2107 (28%) |
25-49K | 562 (24%) | 1752 (28%) | 2037 (27%) | |
50-74K | 481 (20%) | 1075 (17%) | 1368 (18%) | |
75-99K | 301 (12%) | 748 (12%) | 1020 (13%) | |
100-199K | 218 (9%) | 587 (9%) | 879 (11%) | |
200K+ | 0 (0%) | 17 (0%) | 34 (0%) | |
Highest Education Level | No Diploma | 546 | 1903 | 2211 |
Diploma or GED | 1864 | 4321 | 5236 | |
Some College | 455 | 1494 | 1956 | |
Assoc. Degree | 167 | 638 | 851 | |
Bachelors Degree | 339 | 993 | 1302 | |
Higher Degree | 98 | 305 | 474 | |
Total Housing Units | 2,591 | 6,867 | 8,272 | |
--Owner-Occupied | 1,437 | 3,762 | 4,851 | |
--Renter-Occupied | 886 | 2,397 | 2,595 | |
Owner-Occupied Values | < 100K | 1264 | 2683 | 3191 |
100-199K | 151 | 956 | 1360 | |
200-299K | 21 | 76 | 198 | |
300-399K | 1 | 37 | 71 | |
400-499K | 0 | 3 | 8 | |
500K+ | 0 | 8 | 22 | |
Total Working Age Population | 4,179 | 11,383 | 14,138 | |
In Work Force | 2,369 | 6,325 | 8,005 | |
Not In Work Force | 1,810 | 5,058 | 6,133 | |
Workforce Employed | 2,265 | 6,001 | 7,603 | |
Workforce Unemployed | 104 | 323 | 402 | |
Civlian Workforce | 2,369 | 6,325 | 8,005 | |
Military Workforce | 0 | 0 | 0 | |
Total Households | 2,323 | 6,159 | 7,446 | |
Family Households | 1,403 | 3,818 | 4,869 | |
Non-Family Households | 920 | 2,341 | 2,577 | |
Married Couple | 861 | 2,448 | 3,275 | |
Other Family | 542 | 1,370 | 1,594 | |
Married w/Child | 212 | 663 | 909 | |
Single Male w/Child | 52 | 184 | 228 | |
Single Female w/Child | 169 | 532 | 590 |
Population Change Last Two Decades - Plus Projection
2000 | % | 2010 | % | 2020 | % | 2030 | |
---|---|---|---|---|---|---|---|
Indiana | 6,080,485 | +7 | 6,483,802 | +4 | 6,738,573 | +4 | 7,014,880 |
Union County | 7,349 | +2 | 7,516 | -7 | 6,974 | -1 | 6,896 |
Wayne County | 71,097 | -3 | 68,917 | -5 | 65,349 | -3 | 63,583 |
Fayette County | 25,588 | -5 | 24,277 | -7 | 22,570 | -6 | 21,192 |
Total Working Age Population:
Total Households:
Total Working Age Population:
Total Households:
Total Working Age Population:
Total Households: