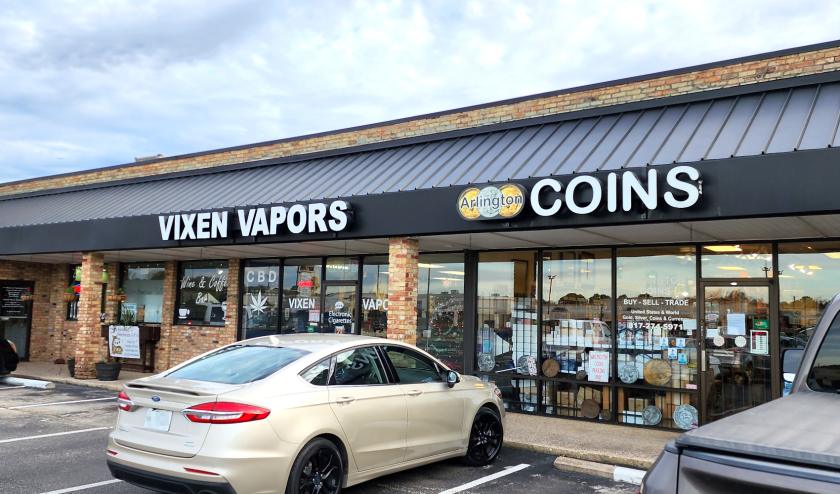
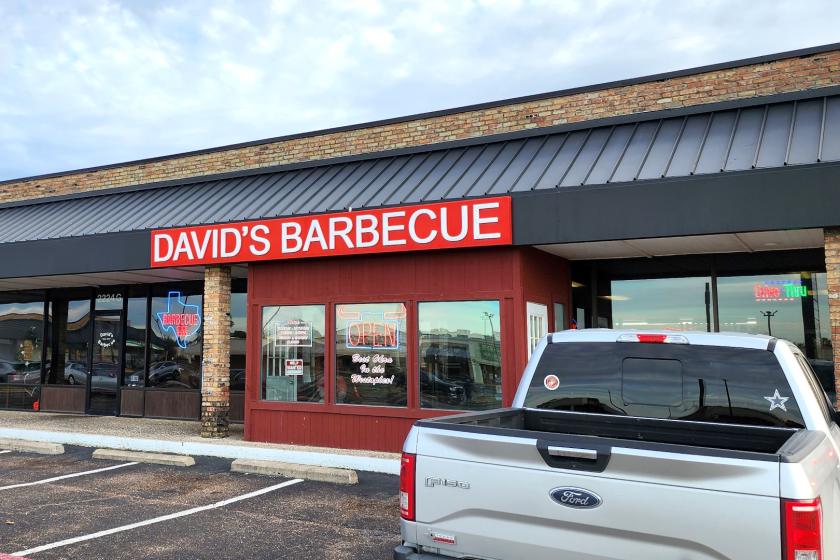
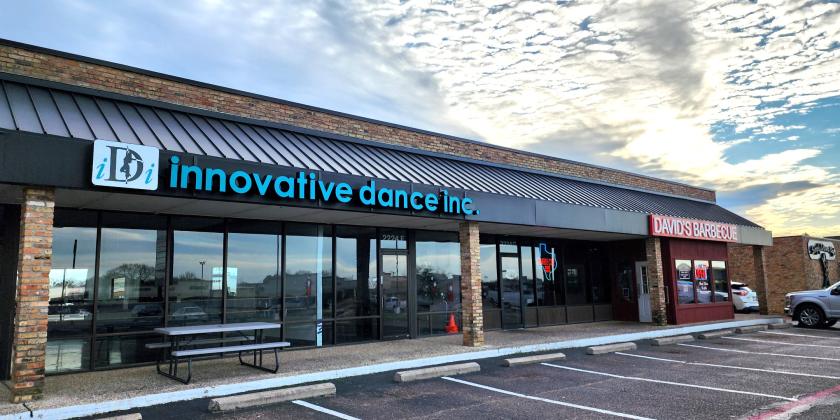
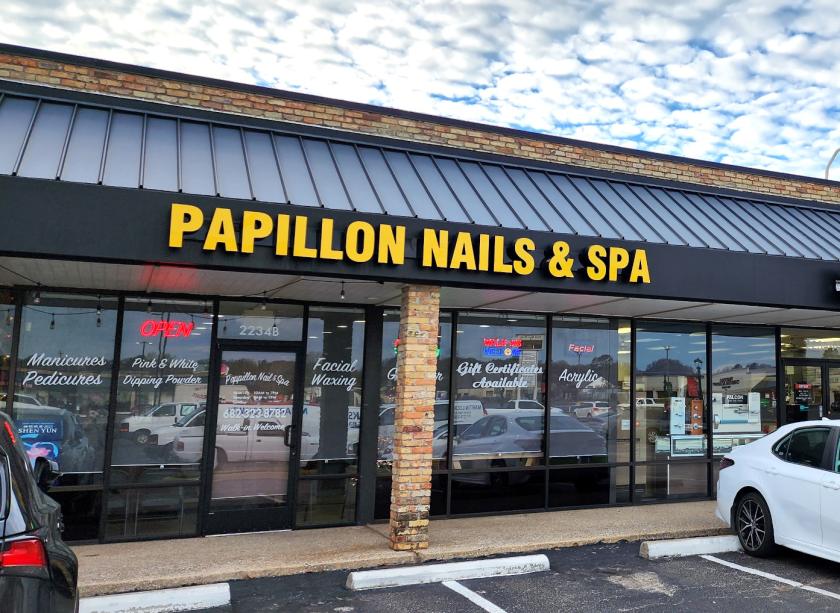
Retail Space
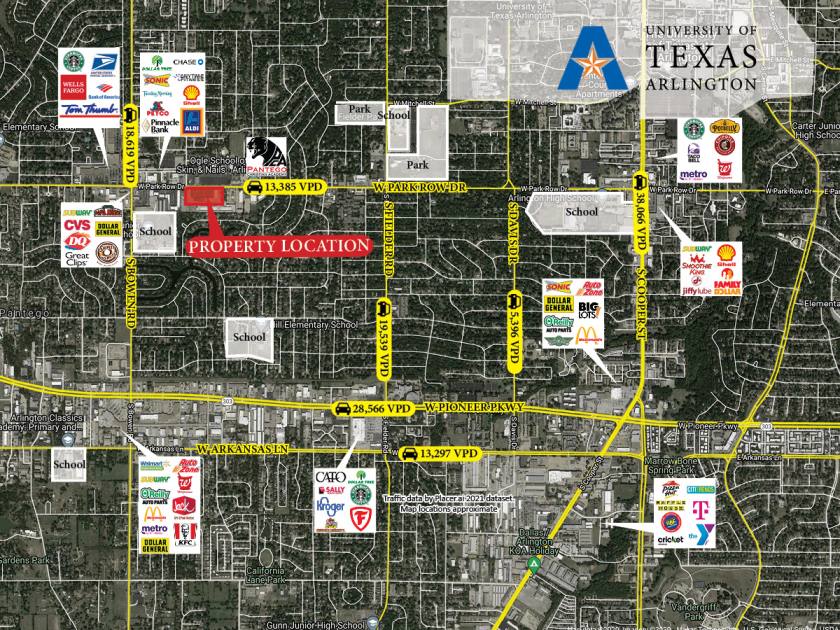
2220-2234 W Park Row Dr Pantego, TX 76013
2220-2234 W Park Row Dr Pantego, TX 76013
Details & Description
Property Highlights
- • 2 mi from The University of Texas Arlington
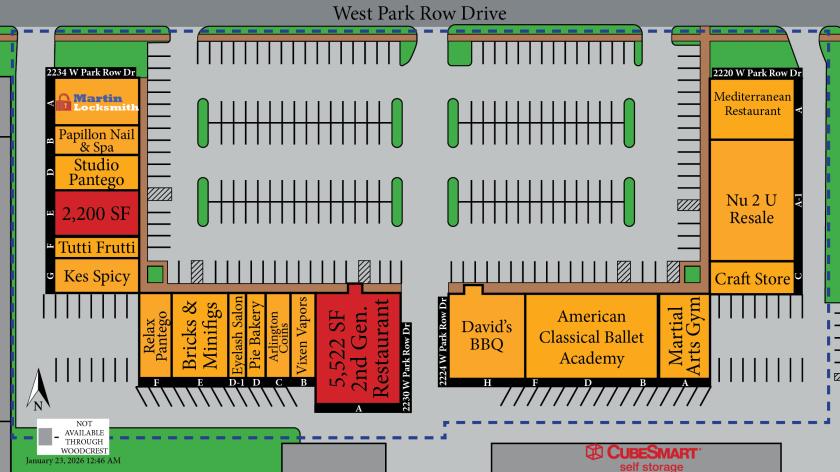
- • Large, LED Lit Parking Field
- • 48,303 SF Center
- • Renovated in 2022
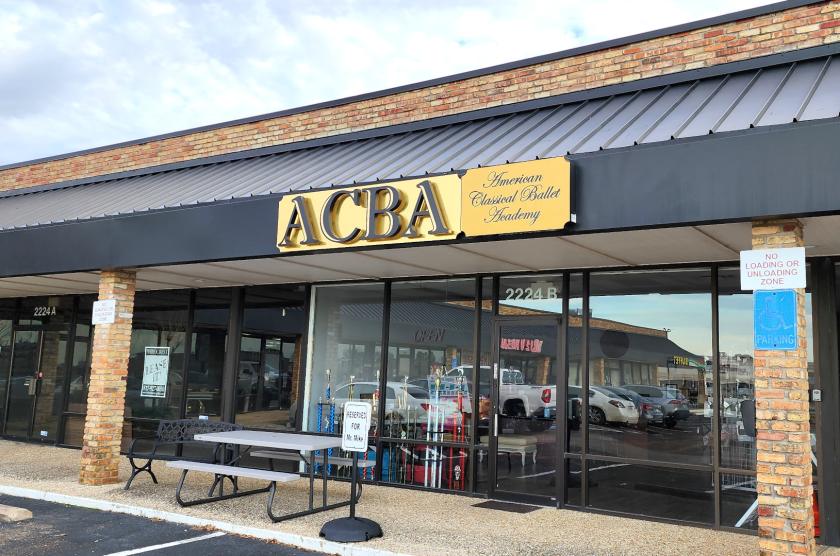
Additional Photos

Listing Agents

Taylor Marks
O: 817-927-0050
tmarks-leads@woodcrestcapital.com
O: 817-927-0050
tmarks-leads@woodcrestcapital.com
While we strive to provide the most accurate information, all listing information, and demographic data, is provided by third-parties. As such, MyEListing will not be responsible for the accuracy of the information. It is strongly recommended that you verify all information with the listing agent, and any relevant agencies, prior to making any decisions.