Office Space
2524 Austin Avenue Waco, TX 76710
2524 Austin Avenue Waco, TX 76710
Details & Description
Property Highlights
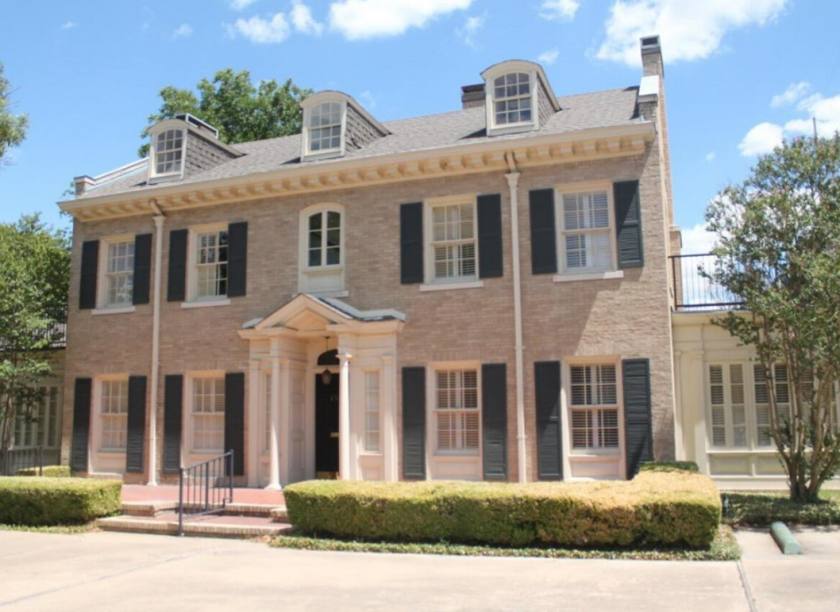
- • Centrally located, easily accessible
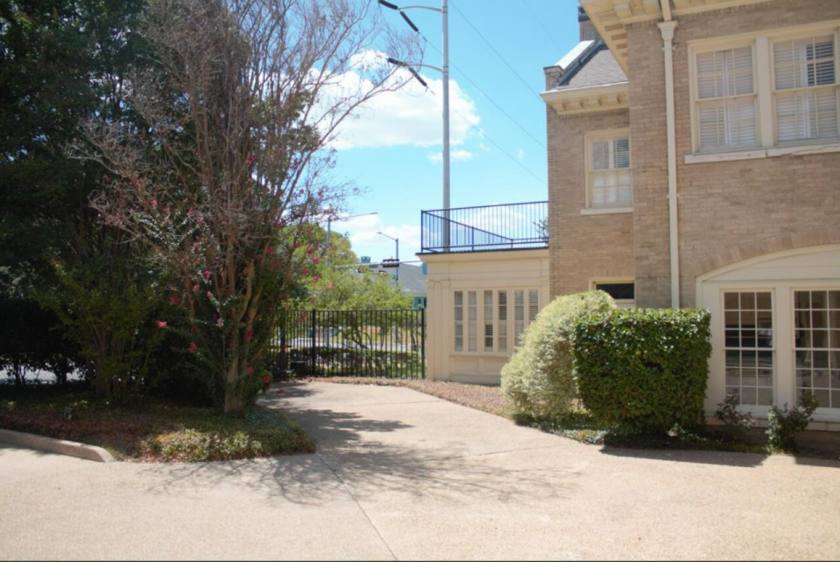
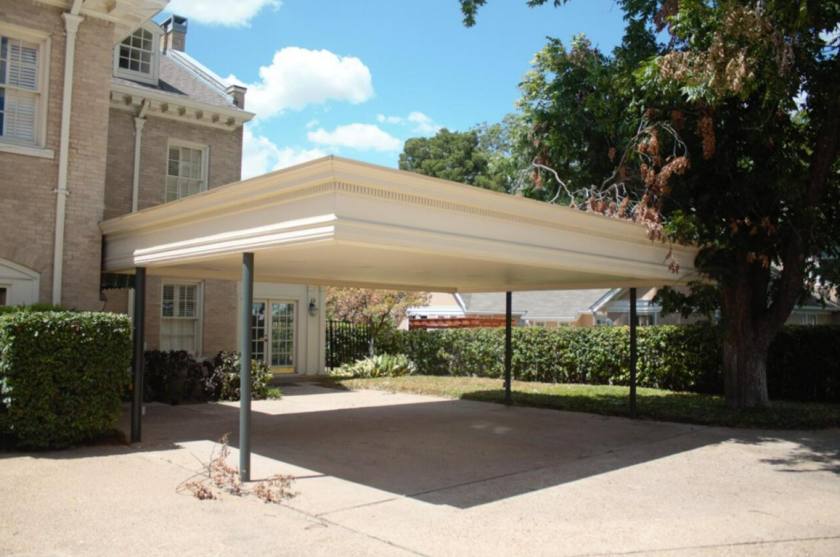
- • 7 parking spots in front, 6 in back
- • More covered parking in rear
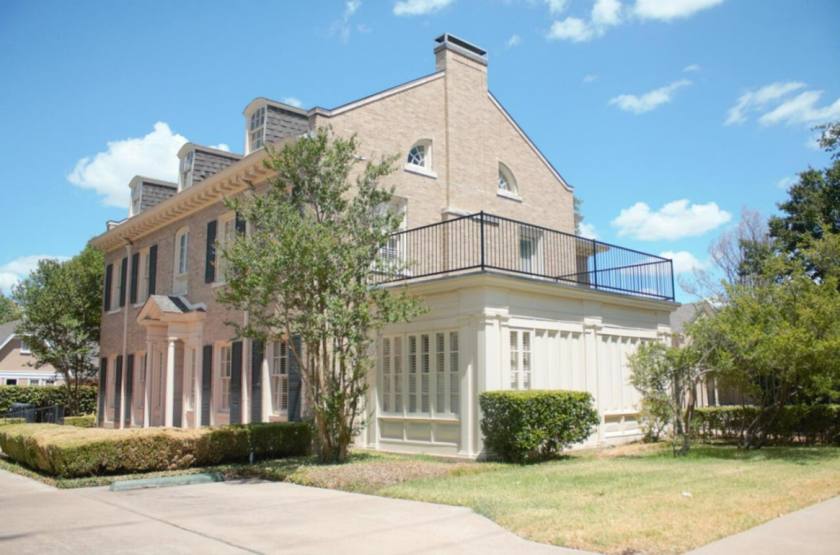
- • Mature trees and landscaping
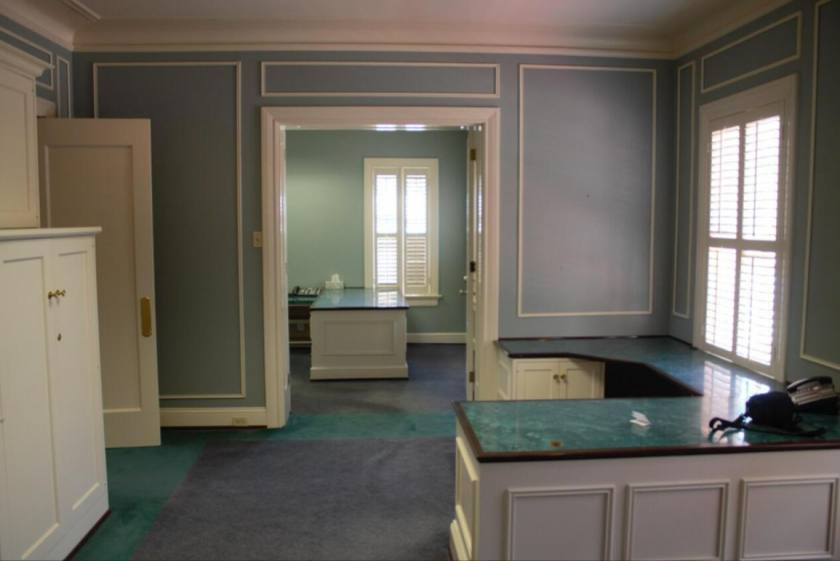
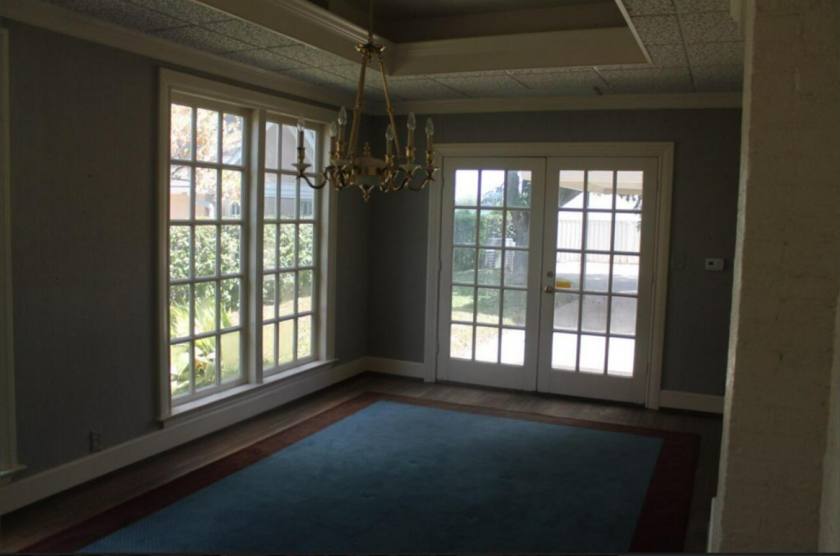
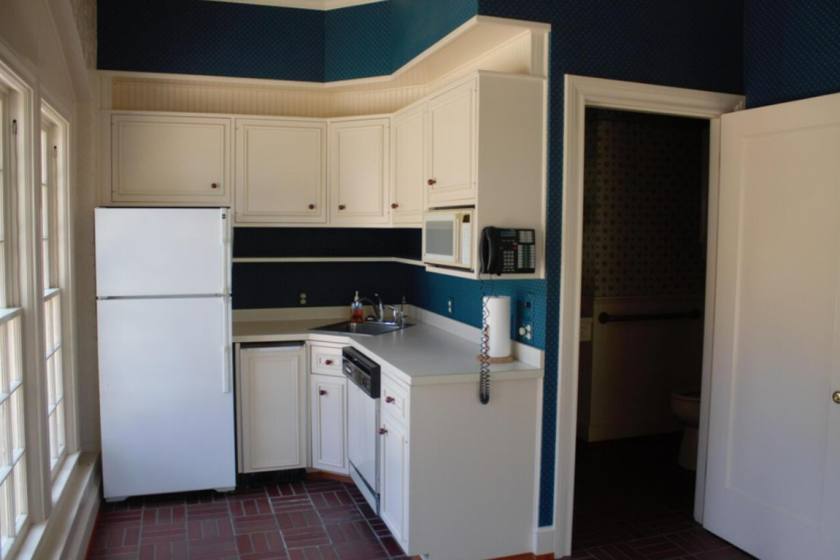
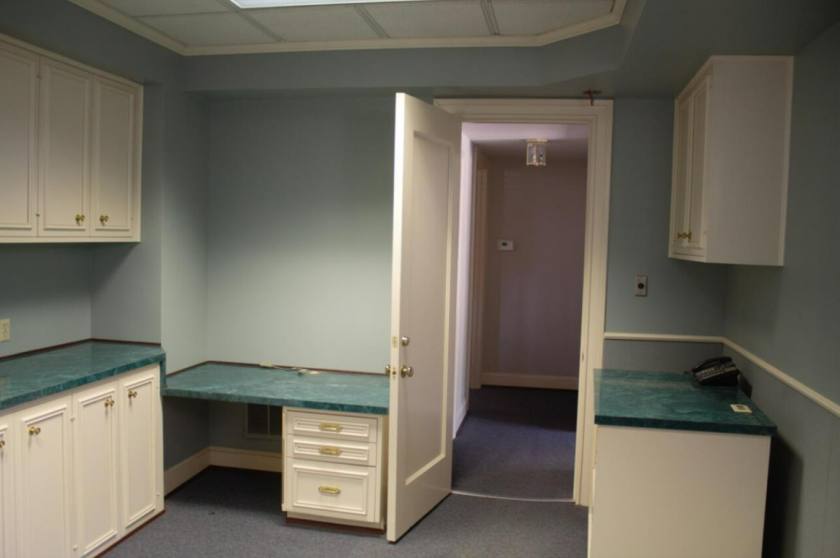
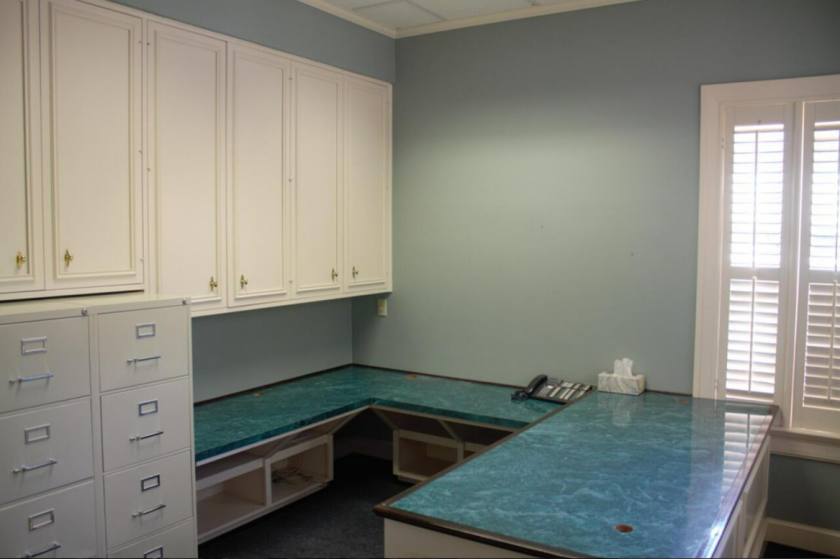
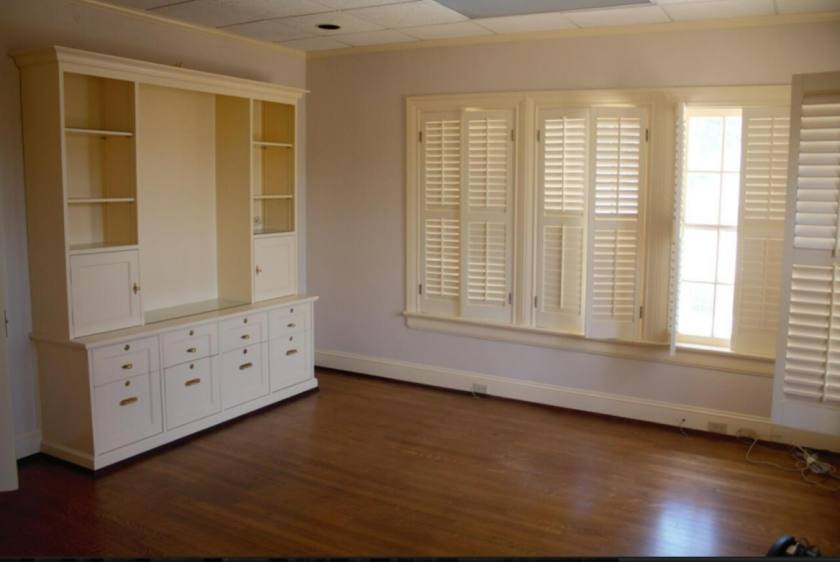
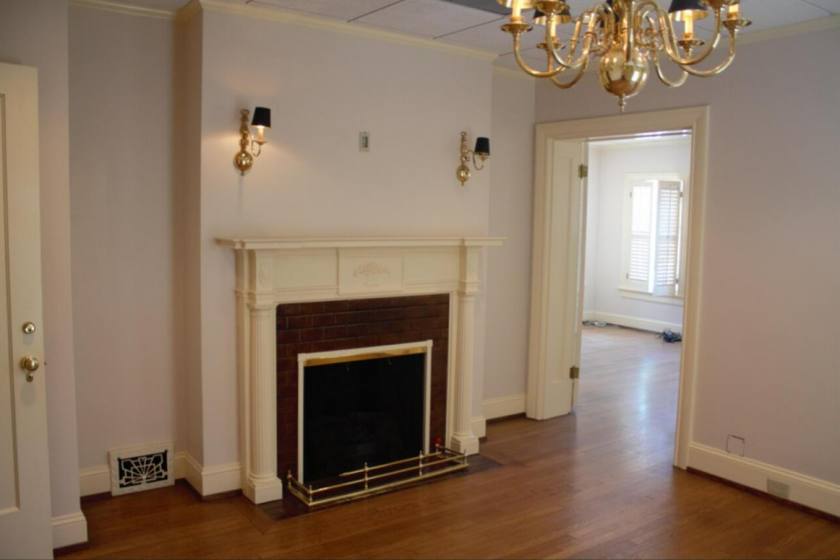
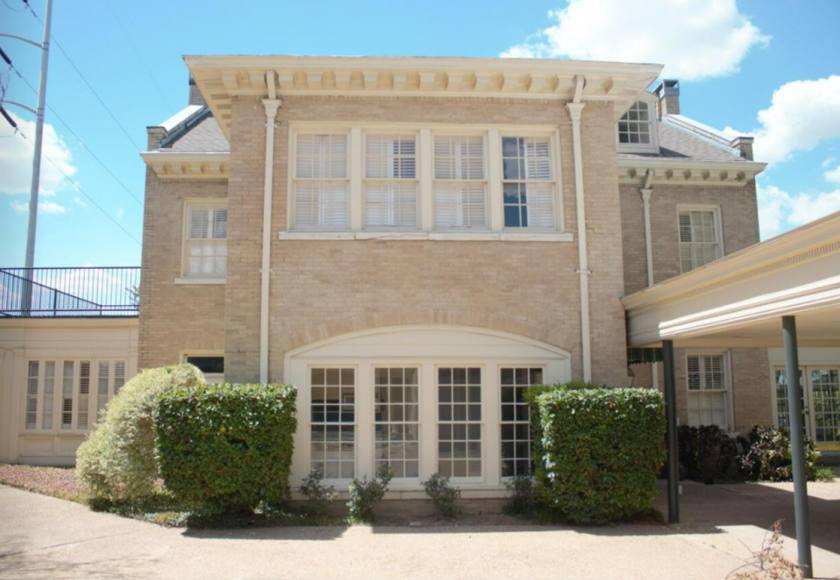
- • Historic home converted to office use
- • Gated private side entry to rear
Additional Photos
Listing Agents

Nathan Embry
O: 254-741-1500
M: 254-855-5500
nathanembryccim@kellyrealtors.com
O: 254-741-1500
M: 254-855-5500
nathanembryccim@kellyrealtors.com
While we strive to provide the most accurate information, all listing information, and demographic data, is provided by third-parties. As such, MyEListing will not be responsible for the accuracy of the information. It is strongly recommended that you verify all information with the listing agent, and any relevant agencies, prior to making any decisions.