Retail Space
4701 South Broadway Los Angeles, CA 90037
4701 South Broadway Los Angeles, CA 90037
Details & Description
Property Highlights
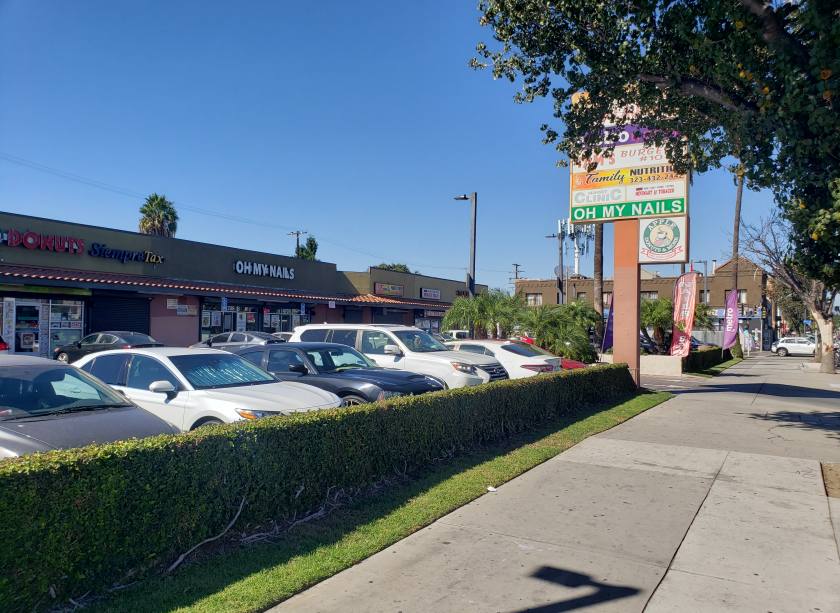
- • Street Frontage Visibility
- • Abundant Parking
- • Minutes to Downtown Los Angeles
- • Diverse mix of businesses & regional tenants
- • Diverse mix of businesses & regional tenants
Additional Photos


Listing Agents

Mike Tolj
O: 323-258-4946
M: 323-317-2561
mike@toljcommercial.com
O: 323-258-4946
M: 323-317-2561
mike@toljcommercial.com
While we strive to provide the most accurate information, all listing information, and demographic data, is provided by third-parties. As such, MyEListing will not be responsible for the accuracy of the information. It is strongly recommended that you verify all information with the listing agent, and any relevant agencies, prior to making any decisions.


