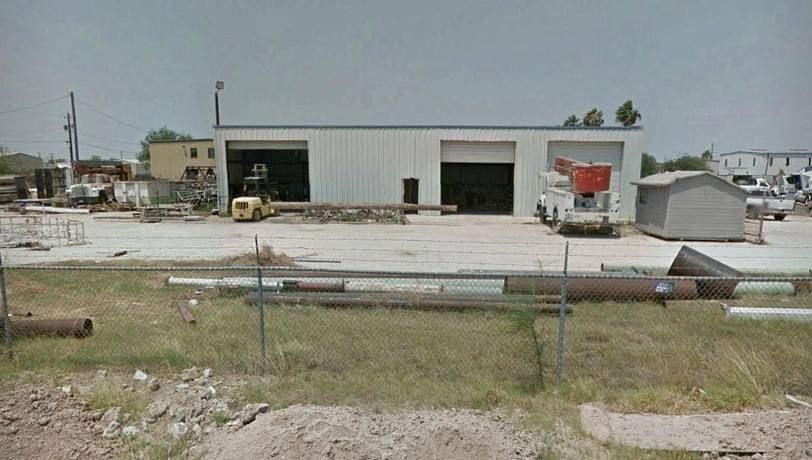
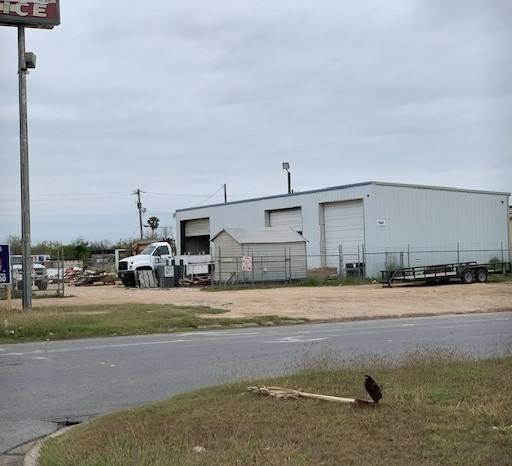
Flex-Office-Warehouse
1501 Mid Cities Drive Pharr, TX 78577
1501 Mid Cities Drive Pharr, TX 78577

Details & Description
Property Highlights
- • Priced for a Quick Sale
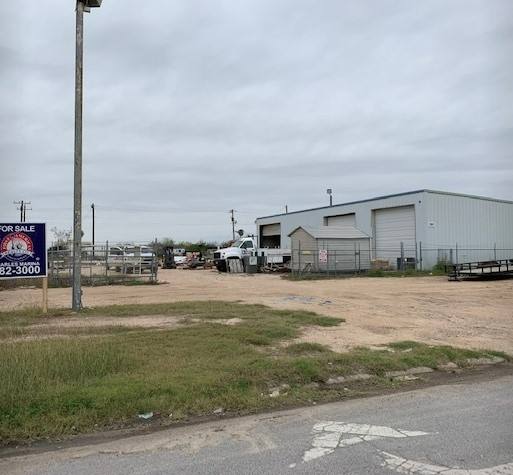
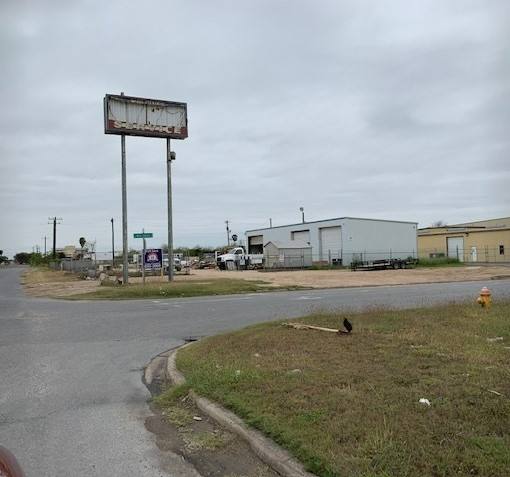
- • Corner Location
- • Overhead Doors
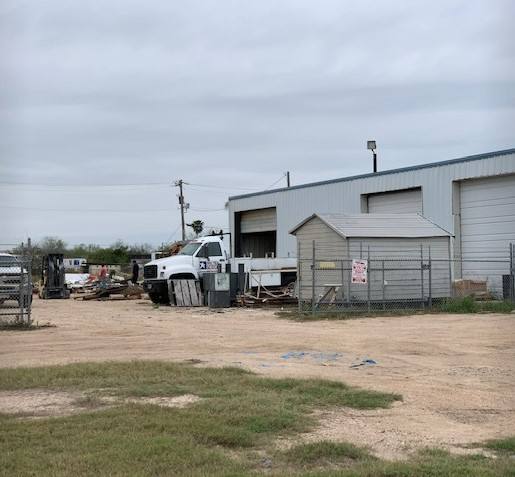
Additional Photos
Listing Agents

Charles Marina
O: 956-682-3000
M: 956-495-3000
cmarina@firstamericanrealty.com
O: 956-682-3000
M: 956-495-3000
cmarina@firstamericanrealty.com
While we strive to provide the most accurate information, all listing information, and demographic data, is provided by third-parties. As such, MyEListing will not be responsible for the accuracy of the information. It is strongly recommended that you verify all information with the listing agent, and any relevant agencies, prior to making any decisions.