Specialty Real Estate
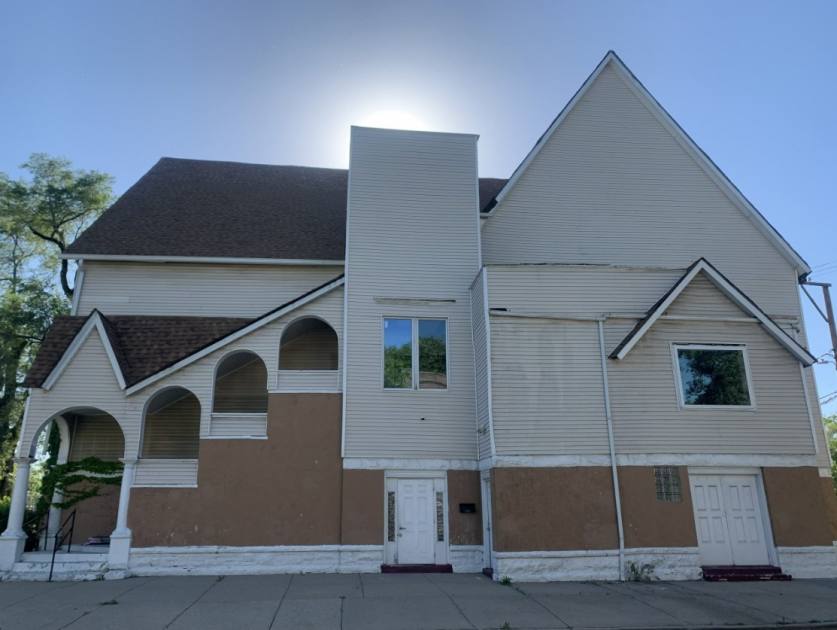
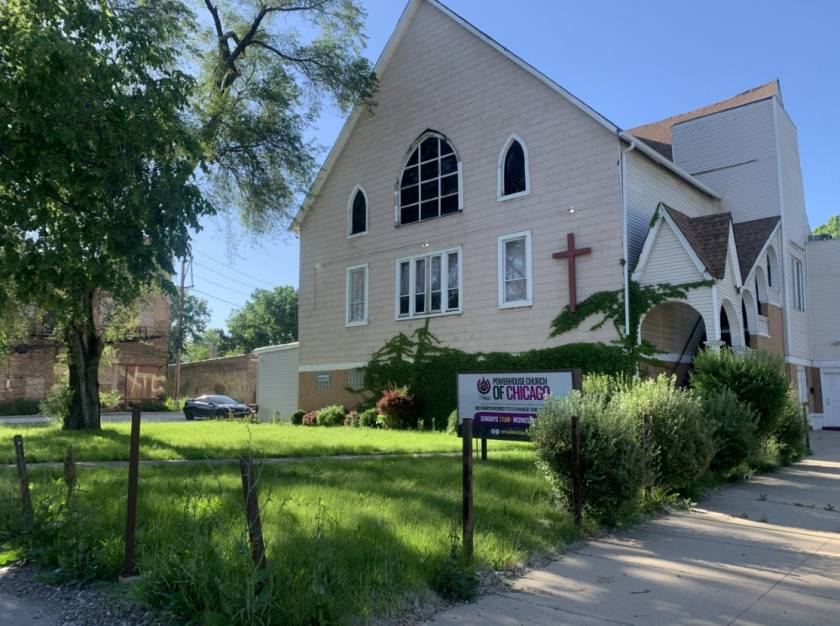
740 West 59th Street Chicago, IL 60621
740 West 59th Street Chicago, IL 60621
Details & Description
Property Highlights
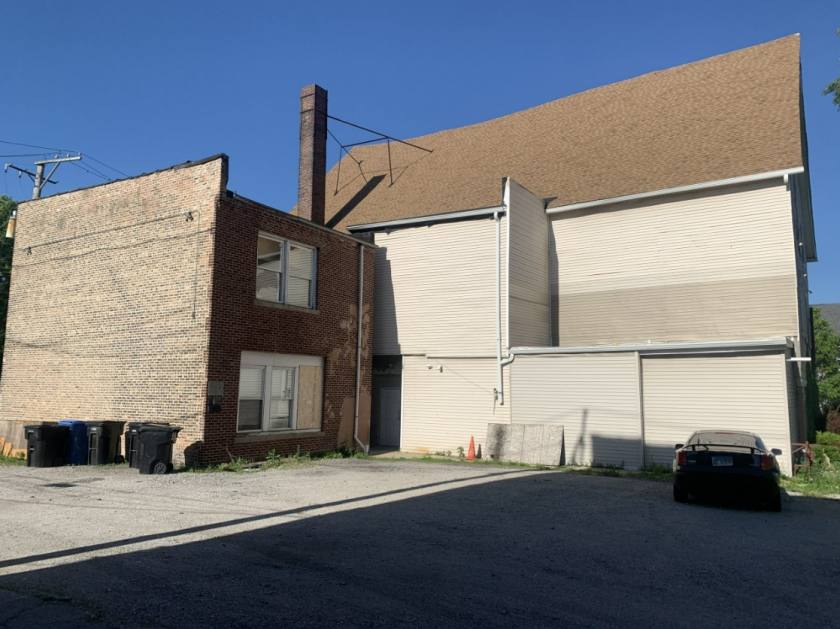
• 31-50 outdoor parking spaces included adjacent to the building
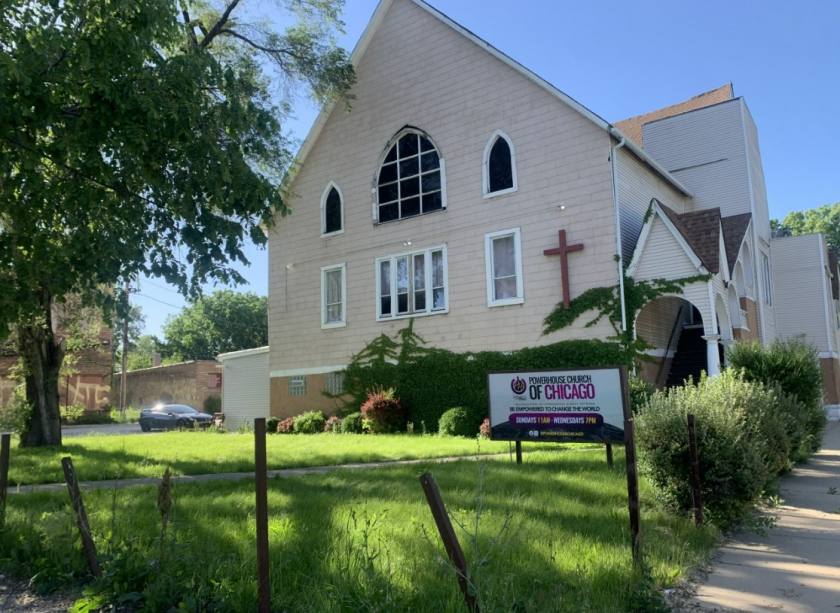
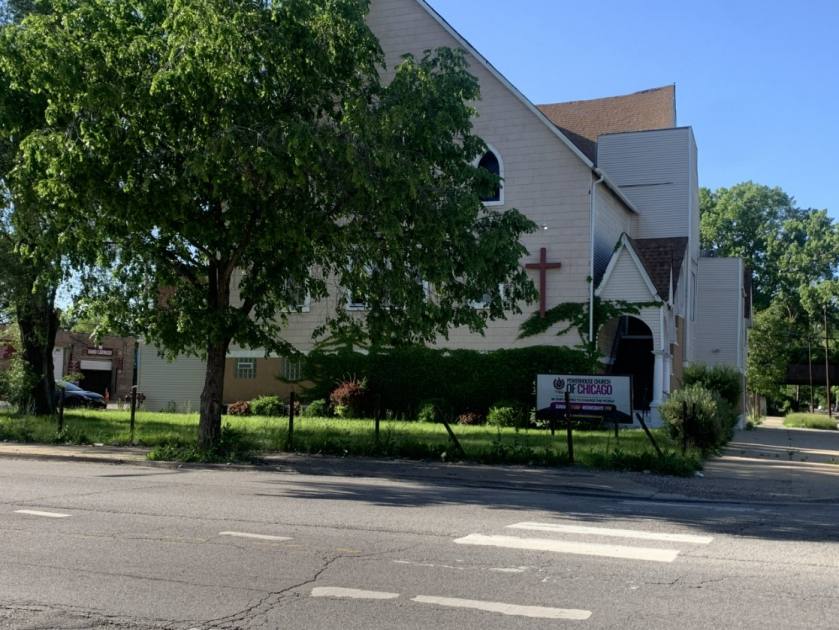
• Formerly Victory Outreach City Church Chicago
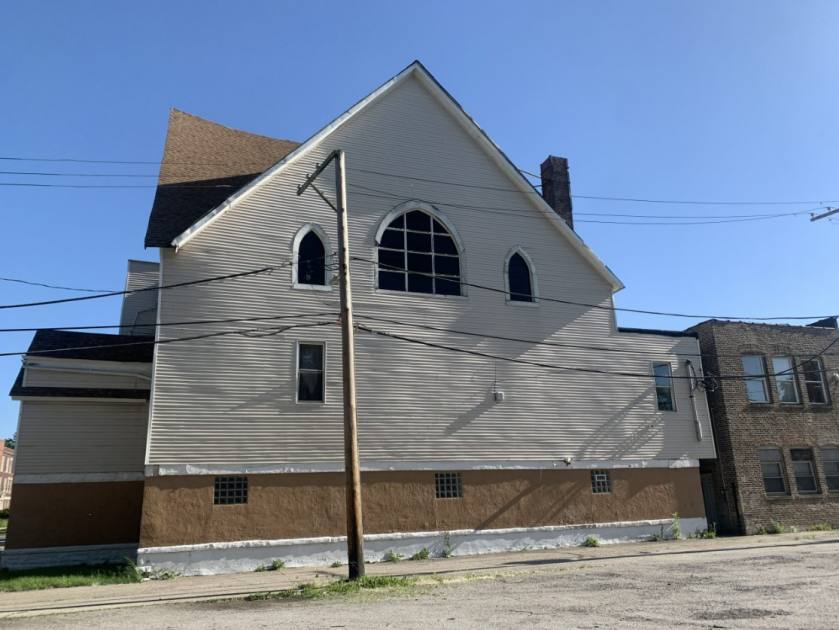
Additional Photos

Listing Agents

Andrea Miller
O: 312-513-8333
andrea@millerchicagorealestate.com
O: 312-513-8333
andrea@millerchicagorealestate.com
While we strive to provide the most accurate information, all listing information, and demographic data, is provided by third-parties. As such, MyEListing will not be responsible for the accuracy of the information. It is strongly recommended that you verify all information with the listing agent, and any relevant agencies, prior to making any decisions.