Industrial Properties
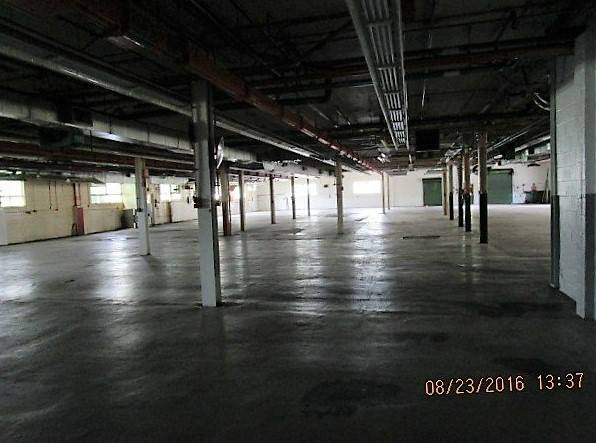
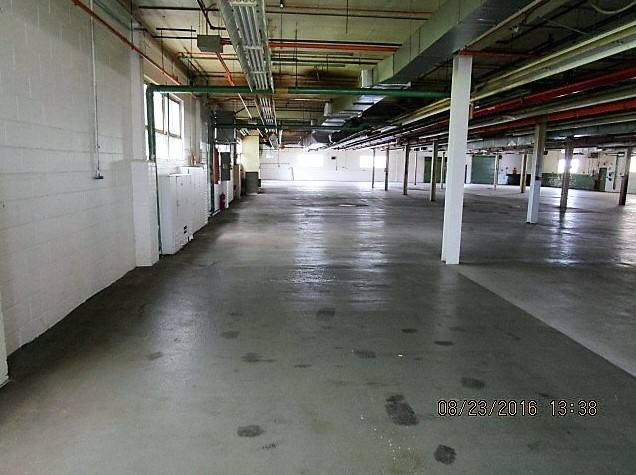
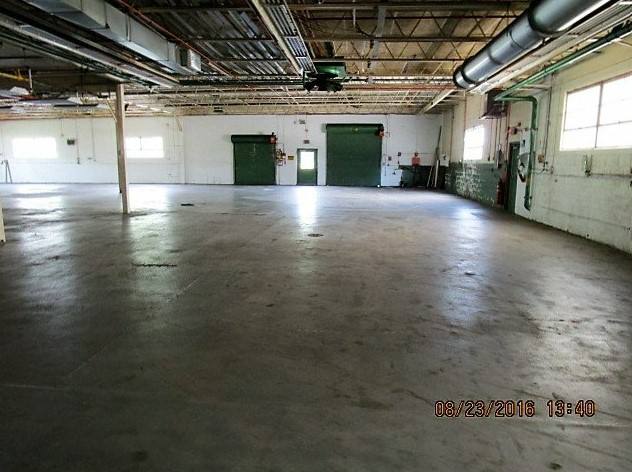
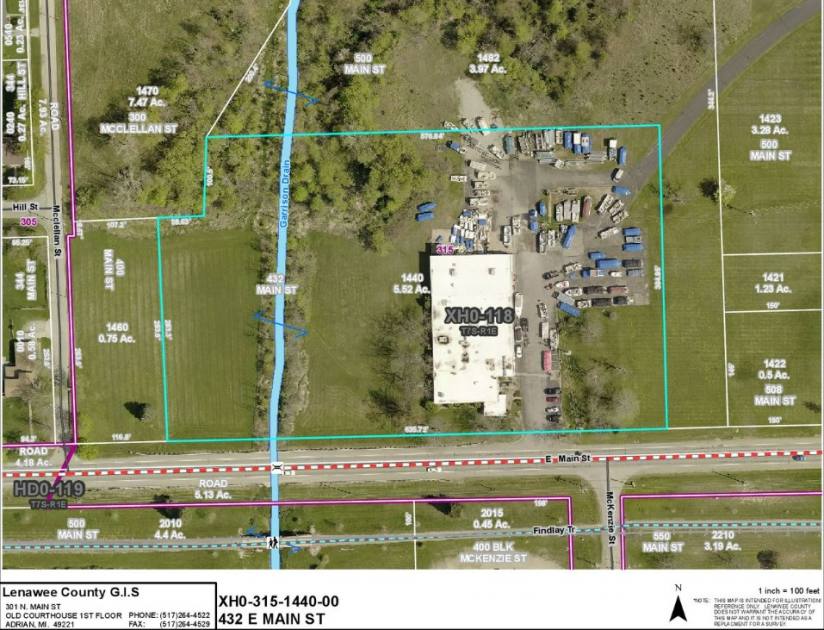
432 East Main Street Hudson, MI 49247
432 East Main Street Hudson, MI 49247
Details & Description
Additional Photos


Listing Agents

Patrick Hoffman
O: 248-342-4604
patrickhoffman@hannacre.com
O: 248-342-4604
patrickhoffman@hannacre.com
While we strive to provide the most accurate information, all listing information, and demographic data, is provided by third-parties. As such, MyEListing will not be responsible for the accuracy of the information. It is strongly recommended that you verify all information with the listing agent, and any relevant agencies, prior to making any decisions.