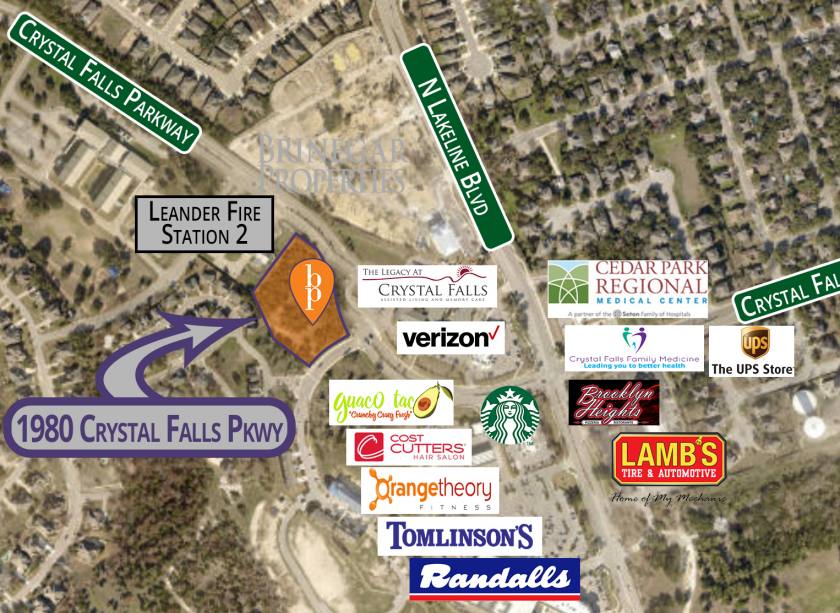
442 ft road frontage on Crystal Falls Parkway
GC Zoning: allows retail and office
190 ft road frontage on Local Rebel St
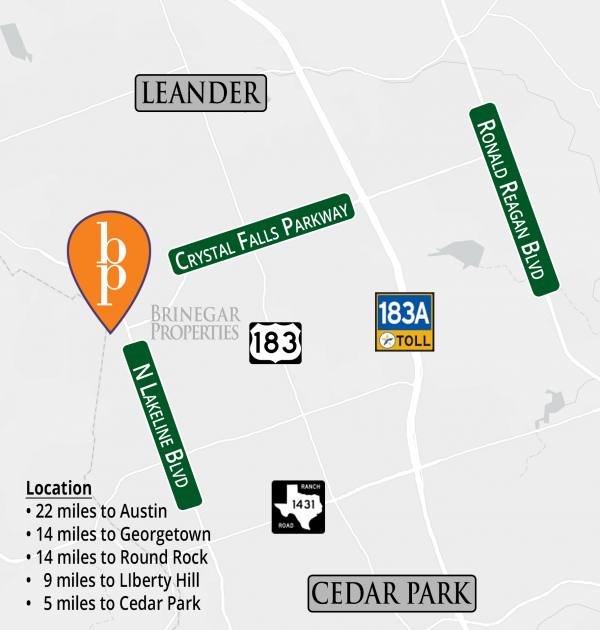
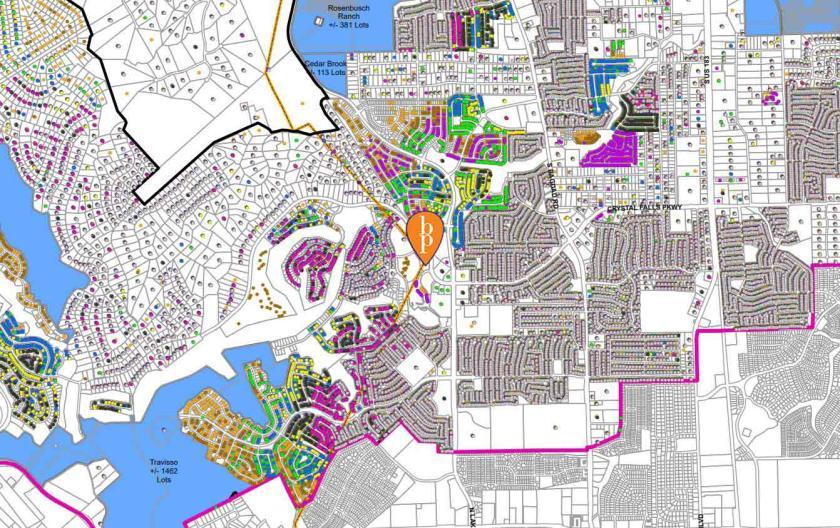
Located 2 3/4 miles west of 183A Toll Road
FOR SALE 1980 CRYSTAL FALLS PKWY, LEANDER, TX 78641
DESIRABLE RETAIL DEVELOPMENT SITE
Looking to invest in a prime retail development opportunity? Look no further than this exceptional property located at 1980 Crystal Falls Pkwy in the booming city of Leander, Texas. With a generous 2.37 acres of land and an impressive 442 feet of road frontage along Crystal Falls Pkwy, this site offers immense potential for retail and office development.
Situated just 2 ¾ miles west of the 183A Toll Road, this location enjoys excellent accessibility and visibility, making it an ideal choice for a wide range of businesses.
The GC zoning permits various retail and office uses, allowing you to bring your vision to life. Surrounded by a thriving community with an average household income of $128,151, the demographics are highly favorable for retail success.
Don't miss out on this incredible opportunity to secure a valuable retail development site in Leander.
2.37 Acres
442 Ft of Road Frontage Along Crystal Falls Pkwy
190 Ft of Road Frontage Along Local Rebel St
Gc Zoning: Allows Retail and Office
Located 2 ¾ Miles West of 183a Toll Road
• $1,548,558
• 2.37 Acres
• 442 ft of road frontage along Crystal Falls Pkwy
• 190 ft of road frontage along Local Rebel St
• GC Zoning: allows retail and office
• Located 2 ¾ miles west of 183A Toll Road
No part of this information may be copied, reproduced, repurposed, or screen-captured for any commercial purpose without prior written authorization from MyEListing.
While we strive to provide the most accurate information, all listing information, and demographic data, is provided by third-parties. As such, MyEListing will not be responsible for the accuracy of the information. It is strongly recommended that you verify all information with the listing agent, and any relevant agencies, prior to making any decisions.
What is the asking price for 1980 Crystal Falls Parkway in Leander?
The asking price for 1980 Crystal Falls Parkway is $1,548,558
How much land does the Leander, TX property at 1980 Crystal Falls Parkway include?
1980 Crystal Falls Parkway in Leander includes 2.370 acres of land
What kind of Land is the propery at 1980 Crystal Falls Parkway?
The property at 1980 Crystal Falls Parkway Leander, TX 78641 is listed as a Office Land Land property
What is the population within 1 mile of 1980 Crystal Falls Parkway in Leander?
The population within 1 mile of 1980 Crystal Falls Parkway Leander, TX 78641 is 12,050 people.
Who do I contact for questions about 1980 Crystal Falls Parkway?
You should contact the listing agent,
Brentley Brinegar, for any details regarding this commercial listing.