Commercial Land
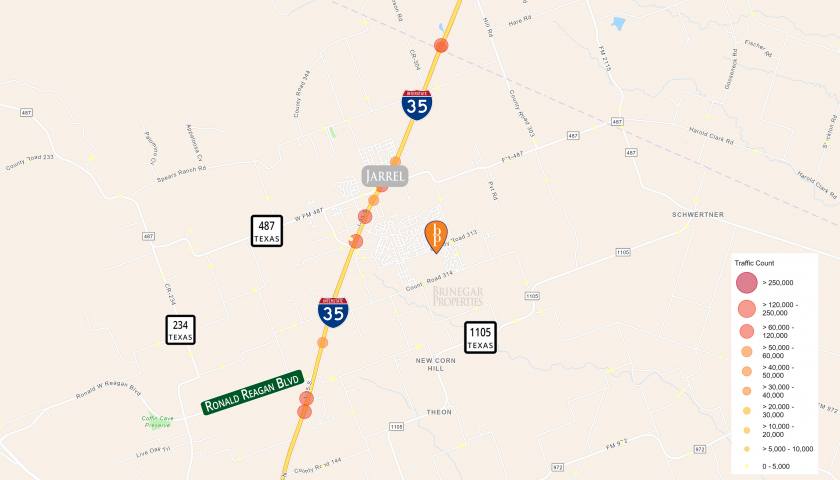
1616 County Road 313 Jarrell, TX 76537
1616 County Road 313 Jarrell, TX 76537
Details & Description
Property Highlights
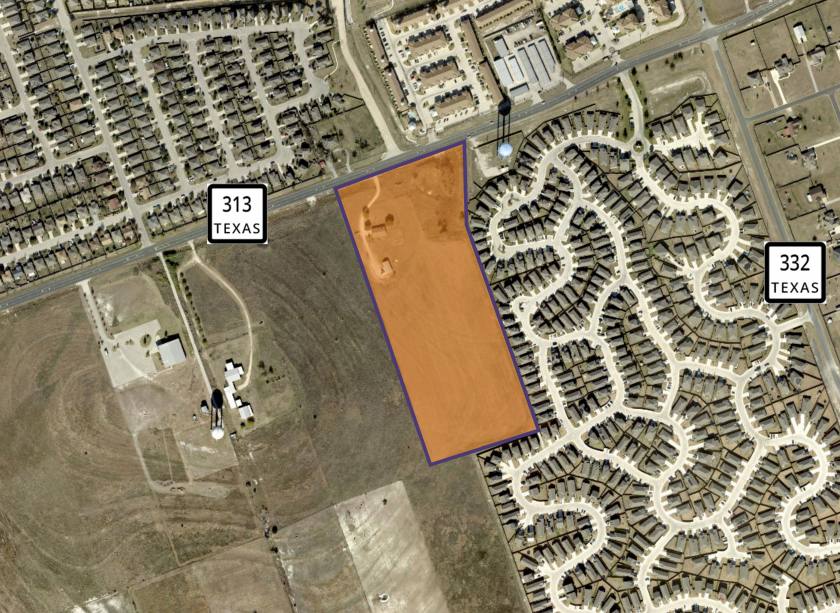
• Possibilities include multi-family, storage, warehouse, church, etc.
• Surrounded by booming residential markets
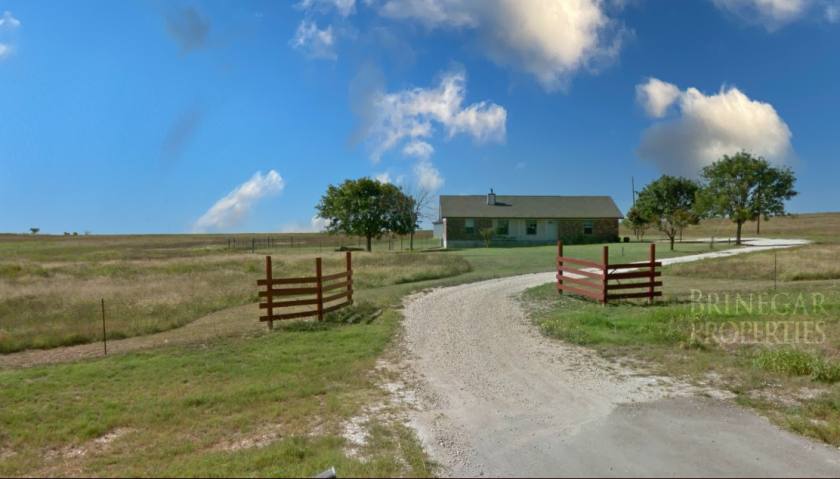
Additional Photos

Listing Agents

Brentley Brinegar
O: 512-940-0188
bb@512texas.com
O: 512-940-0188
bb@512texas.com
While we strive to provide the most accurate information, all listing information, and demographic data, is provided by third-parties. As such, MyEListing will not be responsible for the accuracy of the information. It is strongly recommended that you verify all information with the listing agent, and any relevant agencies, prior to making any decisions.


