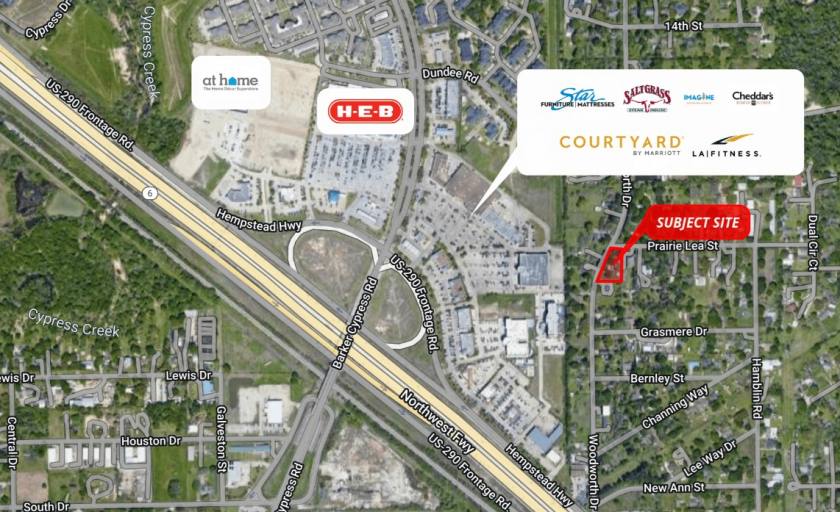
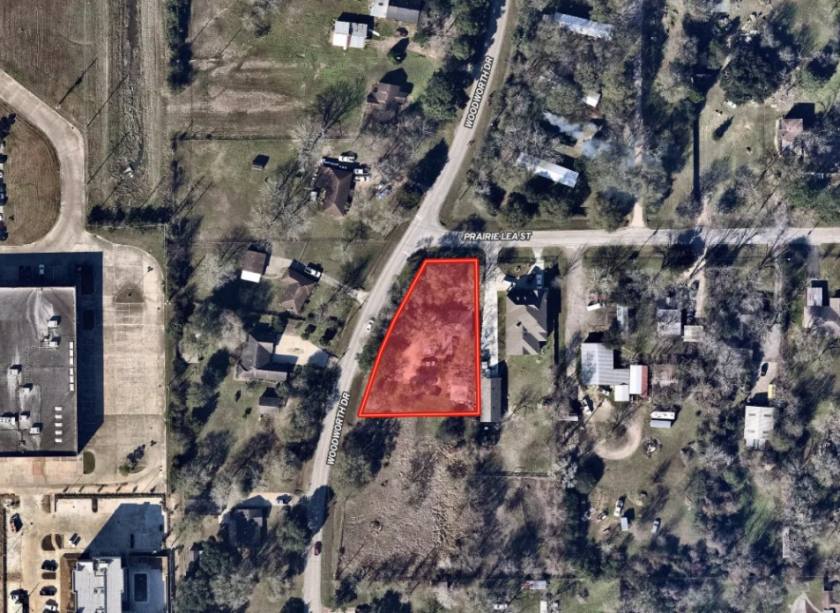
1-Mile | 3-Miles | 5-Miles | ||
---|---|---|---|---|
Total Population | 7,656 | 77,966 | 238,633 | |
Population Median Age | 36 | 35 | 36 | |
Population by Age | 0-9 Yrs | 1058 (13%) | 12098 (15%) | 37037 (15%) |
10-19 Yrs | 1255 (16%) | 12574 (16%) | 35796 (15%) | |
20-29 Yrs | 760 (9%) | 8411 (10%) | 26063 (10%) | |
30-39 Yrs | 970 (12%) | 10417 (13%) | 34323 (14%) | |
40-49 Yrs | 1486 (19%) | 13349 (17%) | 36467 (15%) | |
50-59 Yrs | 707 (9%) | 10158 (13%) | 31095 (13%) | |
60-69 Yrs | 903 (11%) | 6958 (8%) | 22936 (9%) | |
70+ Yrs | 517 (6%) | 4000 (5%) | 14915 (6%) | |
Median HH Income | $95,463 | $104,761 | $97,218 | |
Total Household Income | < 24K | 95 (3%) | 1288 (5%) | 5294 (6%) |
25-49K | 381 (15%) | 2960 (11%) | 10673 (13%) | |
50-74K | 567 (22%) | 4144 (16%) | 13963 (17%) | |
75-99K | 253 (10%) | 3568 (14%) | 10722 (13%) | |
100-199K | 779 (31%) | 8986 (35%) | 27031 (34%) | |
200K+ | 425 (17%) | 4129 (16%) | 11236 (14%) | |
Highest Education Level | No Diploma | 331 | 3303 | 11131 |
Diploma or GED | 835 | 7861 | 26249 | |
Some College | 1089 | 11288 | 35516 | |
Assoc. Degree | 248 | 3437 | 12716 | |
Bachelors Degree | 1738 | 16225 | 47541 | |
Higher Degree | 711 | 7383 | 21215 | |
Total Housing Units | 2,726 | 26,175 | 83,043 | |
--Owner-Occupied | 1,739 | 20,095 | 59,946 | |
--Renter-Occupied | 761 | 4,980 | 18,972 | |
Owner-Occupied Values | < 100K | 68 | 598 | 1709 |
100-199K | 117 | 4206 | 14953 | |
200-299K | 708 | 7825 | 23951 | |
300-399K | 651 | 5125 | 12198 | |
400-499K | 160 | 1383 | 4157 | |
500K+ | 35 | 957 | 2978 | |
Total Working Age Population | 5,708 | 57,386 | 178,362 | |
In Work Force | 4,018 | 41,475 | 124,719 | |
Not In Work Force | 1,690 | 15,911 | 53,643 | |
Workforce Employed | 3,844 | 39,199 | 117,665 | |
Workforce Unemployed | 174 | 2,163 | 6,874 | |
Civlian Workforce | 4,018 | 41,363 | 124,539 | |
Military Workforce | 0 | 112 | 180 | |
Total Households | 2,500 | 25,076 | 78,918 | |
Family Households | 2,030 | 20,123 | 62,479 | |
Non-Family Households | 470 | 4,952 | 16,439 | |
Married Couple | 1,736 | 16,925 | 51,161 | |
Other Family | 293 | 3,198 | 11,318 | |
Married w/Child | 905 | 8,470 | 25,185 | |
Single Male w/Child | 47 | 598 | 1,721 | |
Single Female w/Child | 188 | 1,652 | 4,598 |
Population Change Last Two Decades - Plus Projection
2000 | % | 2010 | % | 2020 | % | 2030 | |
---|---|---|---|---|---|---|---|
Texas | 20,851,820 | +21 | 25,145,561 | +18 | 29,677,668 | +18 | 34,894,452 |
Harris County | 3,400,578 | +20 | 4,092,459 | +22 | 4,978,845 | +19 | 5,924,750 |
Total Working Age Population:
Total Households:
Total Working Age Population:
Total Households:
Total Working Age Population:
Total Households: