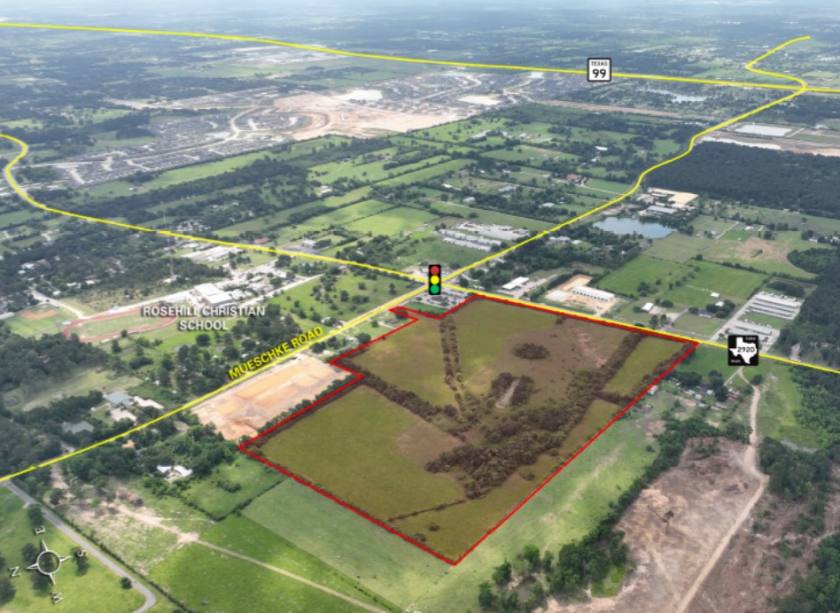
1-Mile | 3-Miles | 5-Miles | ||
---|---|---|---|---|
Total Population | 1,191 | 10,509 | 34,143 | |
Population Median Age | 42 | 37 | 36 | |
Population by Age | 0-9 Yrs | 126 (10%) | 1348 (12%) | 5100 (14%) |
10-19 Yrs | 211 (17%) | 1765 (16%) | 5813 (17%) | |
20-29 Yrs | 62 (5%) | 1158 (11%) | 3313 (9%) | |
30-39 Yrs | 111 (9%) | 1281 (12%) | 4298 (12%) | |
40-49 Yrs | 138 (11%) | 1225 (11%) | 4512 (13%) | |
50-59 Yrs | 229 (19%) | 1739 (16%) | 5404 (15%) | |
60-69 Yrs | 200 (16%) | 1289 (12%) | 3501 (10%) | |
70+ Yrs | 115 (9%) | 704 (6%) | 2202 (6%) | |
Median HH Income | $112,117 | $75,570 | $95,474 | |
Total Household Income | < 24K | 31 (7%) | 552 (15%) | 1337 (12%) |
25-49K | 58 (13%) | 621 (17%) | 1553 (14%) | |
50-74K | 40 (9%) | 567 (16%) | 1591 (14%) | |
75-99K | 49 (11%) | 315 (9%) | 1148 (10%) | |
100-199K | 146 (34%) | 955 (27%) | 3274 (30%) | |
200K+ | 99 (23%) | 485 (13%) | 1940 (17%) | |
Highest Education Level | No Diploma | 46 | 916 | 2408 |
Diploma or GED | 144 | 1962 | 5770 | |
Some College | 221 | 1791 | 5052 | |
Assoc. Degree | 50 | 416 | 1840 | |
Bachelors Degree | 309 | 1472 | 4929 | |
Higher Degree | 65 | 326 | 1584 | |
Total Housing Units | 458 | 3,891 | 11,532 | |
--Owner-Occupied | 395 | 2,987 | 9,707 | |
--Renter-Occupied | 28 | 507 | 1,136 | |
Owner-Occupied Values | < 100K | 19 | 448 | 1112 |
100-199K | 35 | 675 | 1856 | |
200-299K | 86 | 656 | 2411 | |
300-399K | 105 | 392 | 1522 | |
400-499K | 38 | 226 | 876 | |
500K+ | 111 | 590 | 1930 | |
Total Working Age Population | 928 | 8,121 | 25,687 | |
In Work Force | 577 | 5,099 | 16,925 | |
Not In Work Force | 351 | 3,022 | 8,762 | |
Workforce Employed | 563 | 4,706 | 15,951 | |
Workforce Unemployed | 13 | 394 | 974 | |
Civlian Workforce | 577 | 5,099 | 16,925 | |
Military Workforce | 0 | 0 | 0 | |
Total Households | 423 | 3,494 | 10,843 | |
Family Households | 360 | 2,781 | 8,982 | |
Non-Family Households | 62 | 713 | 1,861 | |
Married Couple | 301 | 2,289 | 7,670 | |
Other Family | 59 | 492 | 1,313 | |
Married w/Child | 86 | 866 | 3,397 | |
Single Male w/Child | 6 | 63 | 145 | |
Single Female w/Child | 27 | 173 | 582 |
Population Change Last Two Decades - Plus Projection
2000 | % | 2010 | % | 2020 | % | 2030 | |
---|---|---|---|---|---|---|---|
Texas | 20,851,820 | +21 | 25,145,561 | +18 | 29,677,668 | +18 | 34,894,452 |
Waller County | 32,663 | +32 | 43,205 | +17 | 50,731 | +16 | 59,021 |
Montgomery County | 293,768 | +55 | 455,746 | +35 | 613,951 | +35 | 831,450 |
Harris County | 3,400,578 | +20 | 4,092,459 | +22 | 4,978,845 | +19 | 5,924,750 |
Total Working Age Population:
Total Households:
Total Working Age Population:
Total Households:
Total Working Age Population:
Total Households: