Industrial Properties
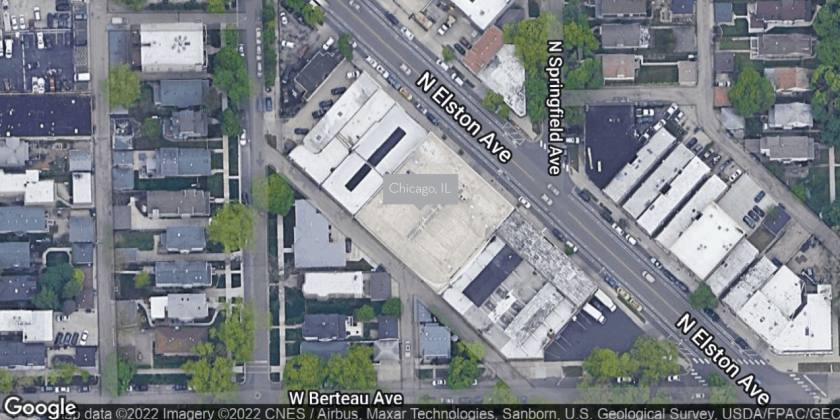
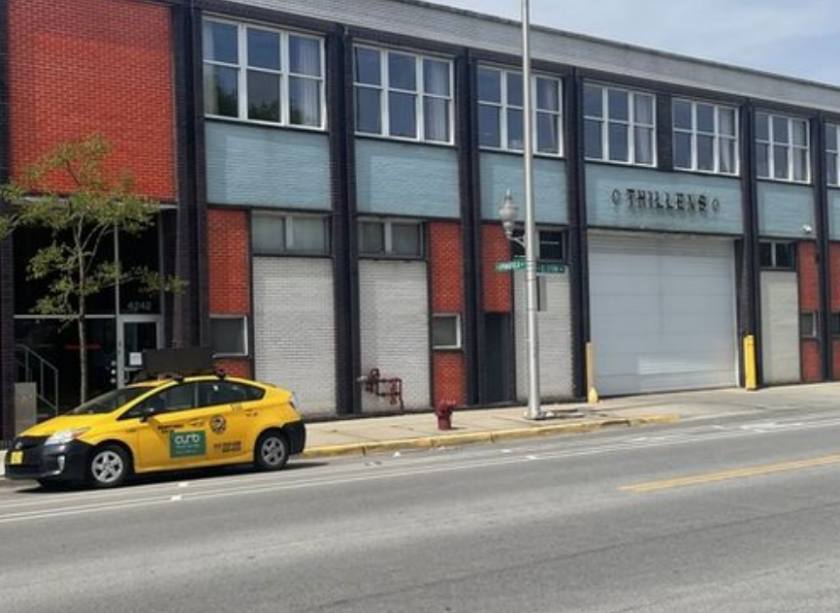
4242 North Elston Avenue Chicago, IL 60618
4242 North Elston Avenue Chicago, IL 60618
Details & Description
Property Highlights
- • Approximately 20,000 sq ft under roof
- • Listed At 7% Cap Rate on Current Income
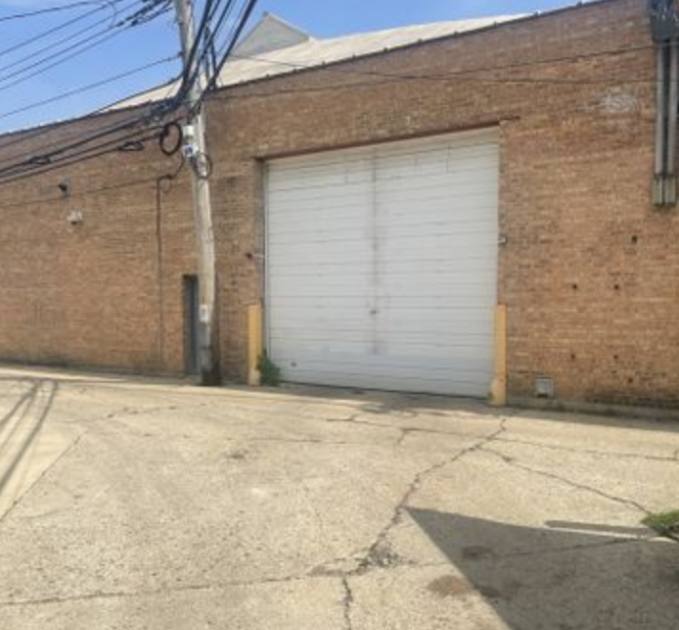
- • Two Drive-In Doors (15')
- • Multiple Office Areas on Two Floors
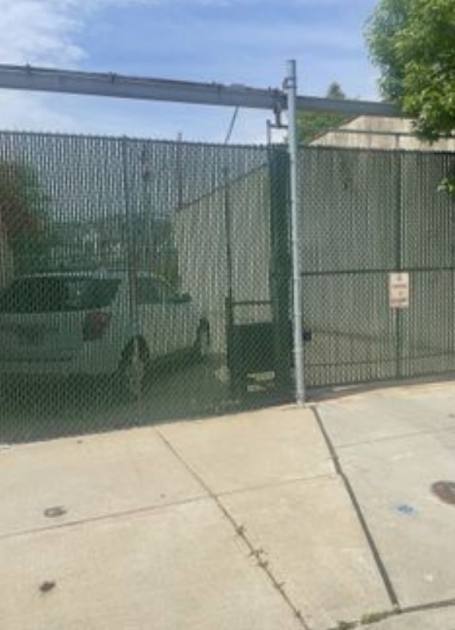
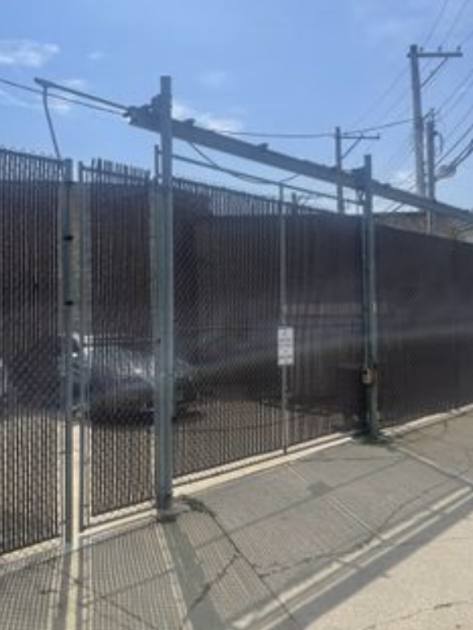
- • Very Secure Facility with Heavy Power
- • Advanced Security System
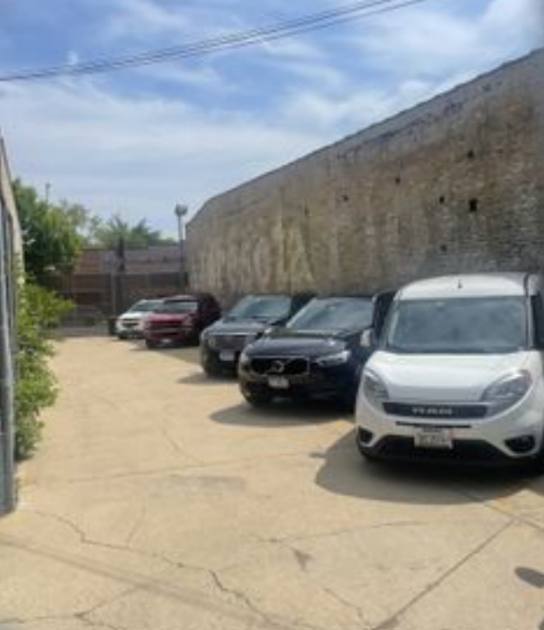
Additional Photos
Listing Agents

Clark Patterson
O: 312-929-1585
M: 312-952-4995
cpatterson@jameson.com
O: 312-929-1585
M: 312-952-4995
cpatterson@jameson.com
While we strive to provide the most accurate information, all listing information, and demographic data, is provided by third-parties. As such, MyEListing will not be responsible for the accuracy of the information. It is strongly recommended that you verify all information with the listing agent, and any relevant agencies, prior to making any decisions.