Industrial Properties
8270 Willow Place Drive North Houston, TX 77070
8270 Willow Place Drive North Houston, TX 77070

Details & Description
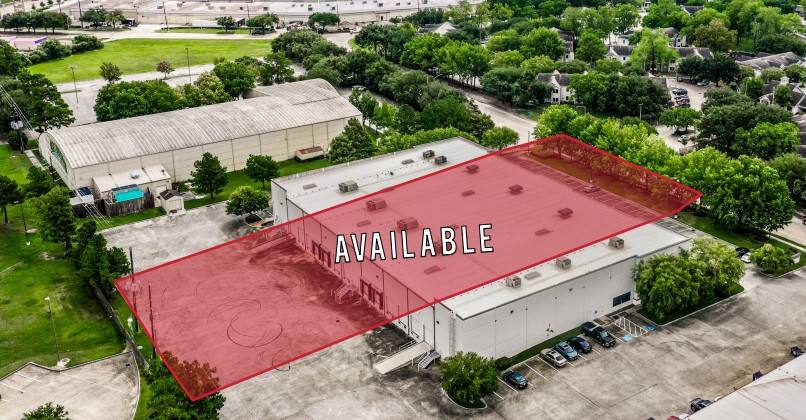
Property Highlights
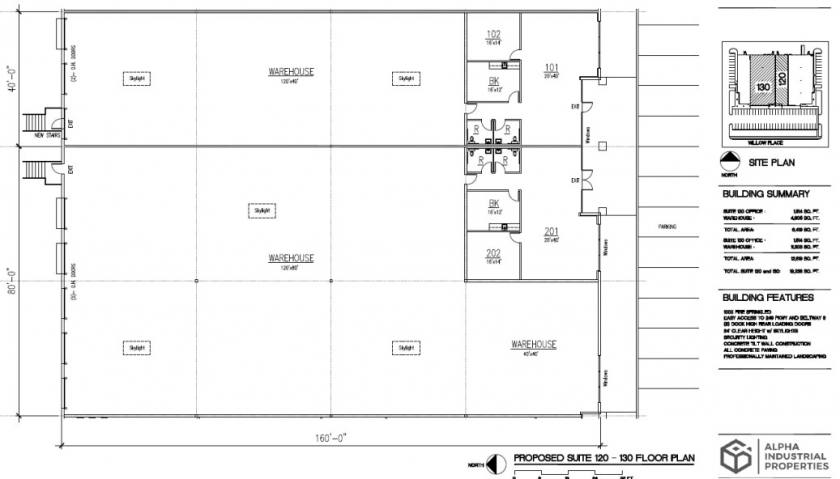
- • Divisible to 6419
- • 3028SF Total Office
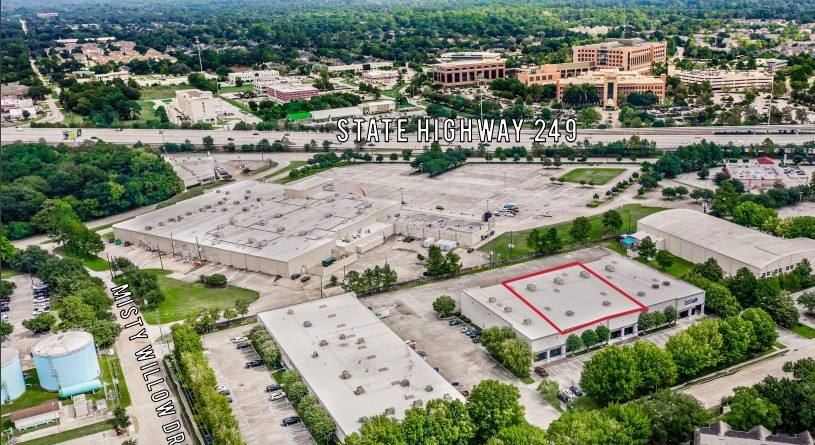
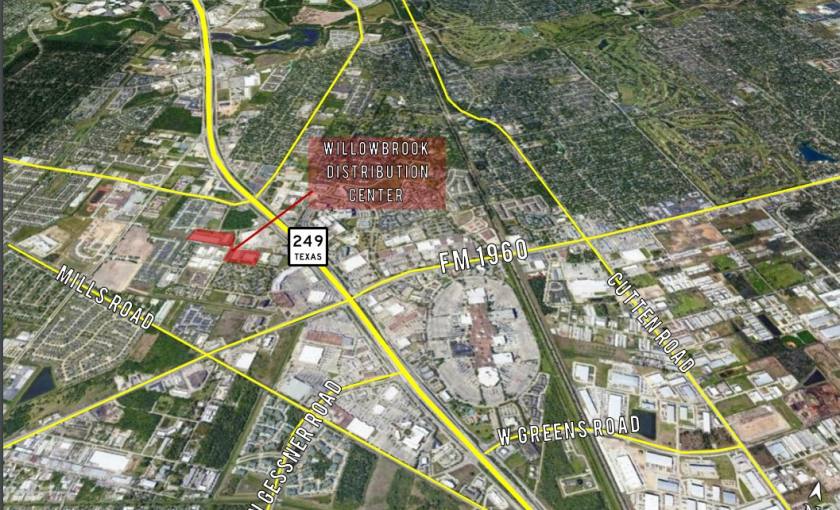
- • Close Proximity to State Highway 249 and Beltway 8
- • Rear-Load Configuration
- • (8) Dock High Loading Doors
- • Ample Parking
Additional Photos
Listing Agents

Gregory Barra
O: 713-599-3406
gbarra@boydcommercial.net
O: 713-599-3406
gbarra@boydcommercial.net

Bo Pettit
O: 713-599-3416
bpettit@boydcommercial.net
O: 713-599-3416
bpettit@boydcommercial.net
While we strive to provide the most accurate information, all listing information, and demographic data, is provided by third-parties. As such, MyEListing will not be responsible for the accuracy of the information. It is strongly recommended that you verify all information with the listing agent, and any relevant agencies, prior to making any decisions.


