Industrial Properties
1403 Thompson Park Drive Baytown, TX 77521
1403 Thompson Park Drive Baytown, TX 77521
Details & Description
Property Highlights
- • Minutes from 1-10 Spur 330
- • Easy Access to BW-8, Grand Parkway and Highway 225
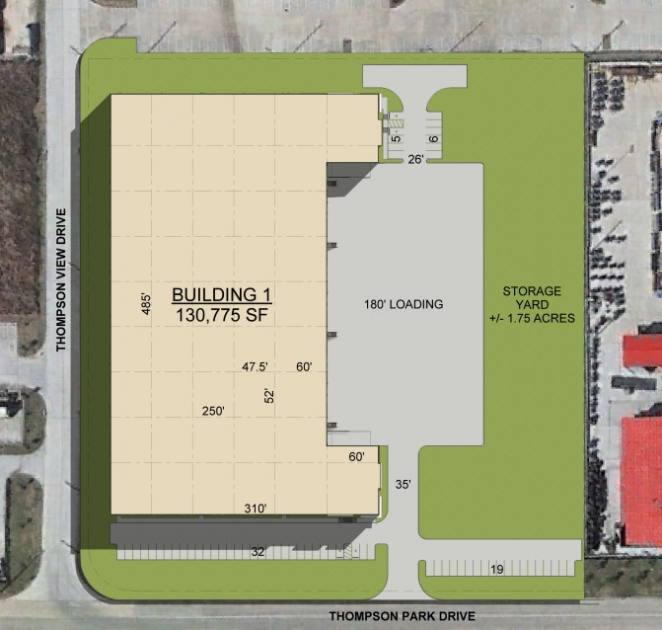
- • Divisible to 45,500 SF
- • 32' Clear Height
- • 52' x 47.5 Column Spacing
- • 18 Dock-High Doors and 2 Ramps
Listing Agents

David Munson
O: 713-599-3438
dmunson@boydcommercial.net
O: 713-599-3438
dmunson@boydcommercial.net

Garrett Thomas
Boyd Commercial
O: 713-599-3404
M: 713-877-8400
gthomas@boydcommercial.net
Boyd Commercial
O: 713-599-3404
M: 713-877-8400
gthomas@boydcommercial.net
While we strive to provide the most accurate information, all listing information, and demographic data, is provided by third-parties. As such, MyEListing will not be responsible for the accuracy of the information. It is strongly recommended that you verify all information with the listing agent, and any relevant agencies, prior to making any decisions.