Commercial Land
County Rd 413 Pearland, TX 77584
County Rd 413 Pearland, TX 77584
Details & Description
Property Highlights
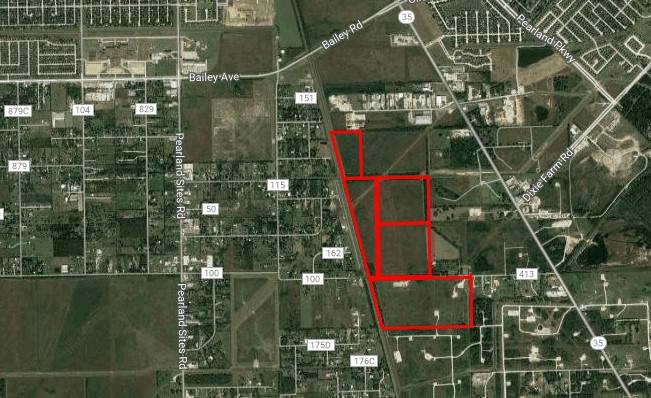
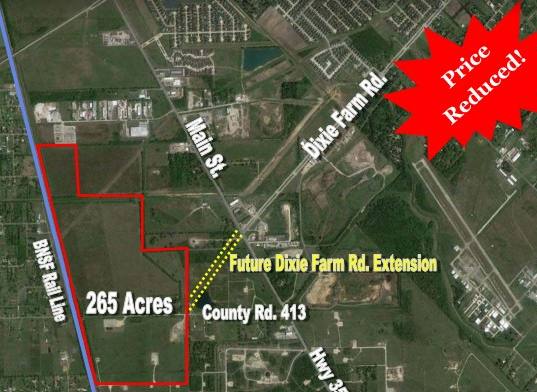
- • Just west of Main St. aka Hwy 35 in Pearland
- • Current Access provided by County Rd. 413
- • Investment/Development Land
- • No Utilities
- • Potential Rail Line access
Listing Agents

Andrew Sowell
O: 713-599-3440
M: 713-725-2612
asowell@boydcommercial.net
O: 713-599-3440
M: 713-725-2612
asowell@boydcommercial.net

David Boyd
O: 713-599-3454
dmboyd@boydcommercial.net
O: 713-599-3454
dmboyd@boydcommercial.net
While we strive to provide the most accurate information, all listing information, and demographic data, is provided by third-parties. As such, MyEListing will not be responsible for the accuracy of the information. It is strongly recommended that you verify all information with the listing agent, and any relevant agencies, prior to making any decisions.